Back on Jan 19, i posted a LT chart of SPX showing the completion of a 5 wave impulse with a wave 5 extension. That completed the wave 1 of the impulse. That also said a wave 2 bear market was underway with a LT target of SPX 1160.
LT sell
The unfolding structure and the market dynamics at that time called for a quick drop to 1160. But the massive Fed intervention created a temporary bottom around 1250 and we rallied.
I said in that post
So we in a primary degree wave 2 bear trend at this stage, until proven otherwise. The implication is that the Oct 02 bottom was a cycle degree wave 4bottom, which should not be violated for decades to come.
Many bears are expecting a repeat of the 2000-2002 bear market and some expecting the Oct 2002 lows to be taken out. I have to respectfully disagree here on both the counts. 2000-2002 was a cycle degree collapse. Right now we are in a primary degree wave 2 bear trend. Big difference.
The last two of weeks of action has pretty much ruled out a 2000-2002 style collapse. Remember in bull markets the tops are complex and the bottoms are simple. It's the opposite in the bear market, when tops tend to be simple and bottoms are complex. Take a look at the weekly CCI during the entire 2000-2002 bear. As soon as the weekly CCI used to get overbought i.e move above 100, it used to result in a immediate collpase in prices. The weekly CCI never stayed above 100 for more than a week or two. That's a simple top and a classic weekly downtrend in progress from a momentum perspective. Right now we are dealing with a situation where the weekly CCI has been above 100 for the last 6 weeks. That's not a simple top, but a complex top on the CCI. In other words we have started uptrending from a momentum perspective. Although we have the 8 EMA still below the 34 EMA, momentum which leads price is saying we are uptrending on the weekly timeframe. That is not exactly what you would see in a full fledged bear market.
Now whether you call it a bull market correction or a bear market depends on one's definition. To me, it's not a bull market, until we have the weekly MACD above zero and bottoms above bottoms configuration on the weekly charts. So i continue to label it as a bear market.
Now the bull-bear dividing IT pivot comes around 1324. As long as SPX 1324 holds, the path of least resistance on the weekly chart will continue to be upward. For IT traders, long is the right trade. I was expecting a ST top on Friday, but it came on Monday. Now this ST decline will tell the story for the next 6-8 months. If we get a choppy sideways to down decline into SPX 1360-70 area and if daily gets oversold and turns back up around that area, then it's very bullish IT and we could move up to test the SPX 1500-20 area. For the bears to regain control, we need to break the IT pivot at 1324 - Period !. Now i keep asking myself, is there energy in the bear to do that ? Without putting my own bias in the front, i will let this ST decline give me clues.
Now does that mean the bear market ends if we hold the SPX 1360-70 area. A five year bull market is not going to end with a mere 6 month correction. Structurally, it does not make any sense from a e-wave perspective. That means SPX will not make new all time highs, but will do a deep retest of the 2007 highs. Bottomline, if 1360-70 area holds over the next few weeks, there's another 150+ points of potential SPX run to the upside. Bull or bear, i would not want to miss that.
Good luck.
Tuesday, May 20, 2008


Trade update
Closed my SKF position between 106 and 106.30 for about 5% profits. Still holding GLD long.
Friday, May 16, 2008
Weekly trends
I will try to post some weekly trends from my position trading system here going forward, once a week. These are multi-week position trades which require 5-8% stop aiming for 10-15% or higher profits.
Gold
Gold never entered a bear trend on the weekly charts, despite the big correction off of the March 08 highs. The weekly 8 EMA continues to reside above the 34 EMA. Now i have a fresh buy on GOLD as of this week's close. So essentially it's a trend continuation buy. The target for Gold is about 970-980 or higher. I took a position in GLD at 89.
Silver
Silver dissapointed from entering a weekly buy. Missed by a narrow margin. Not sure if that's a red flag for Gold or if it's just lagging behind gold. No positions here.
Euro
The Euro is on a counterend sell i.e a correction on the weekly charts. The 8 EMA continues to resides above the 34 EMA and the weekly trend reamins up. But we marginally failed to get a continuation buy on Euro, thus putting it still in the correction camp. Again whether this non-confirmation remains a red flag for Gold remains to be seen. Interestingly the ETF FXE issued a buy. Maybe the ETF folks are over enthusiastic here. We shall see..
No positions here.
Financials
XLF remains on a weekly continuation sell from last week. XLF needs to take out 28 to invalidate this signal. I remain long SKF from 101 last week.
S&P
The weekly trend continues to remain down on the S&P. 8 EMA below 34 EMA. We are in a large correction in a downtrend. But a couple of more weeks of upside action could turn the weekly trend up. ST continues to confound me. Everyday looks like a top, only to be taken out by a surreptitious slow rally. Typical of a trending market. My system says Friday was a ST top, but again the late day OPEX shenanigan put a damper on that signal. Next weeks things should get clearer.
No positions here. Only daytrading.
OIL
WOW. The strong uptrend on weekly charts continues. DUG seems to be the darling of the masses, just like QID was in 2006, making fresh lows day after day. But the enthusiasm of the OIL bears remains unfazed. It remains to be seen, if finally the OIL bears get the much needed correction or just get blown out by the charging bull. No easy trades in this market at all.
No positions here.
Gold
Gold never entered a bear trend on the weekly charts, despite the big correction off of the March 08 highs. The weekly 8 EMA continues to reside above the 34 EMA. Now i have a fresh buy on GOLD as of this week's close. So essentially it's a trend continuation buy. The target for Gold is about 970-980 or higher. I took a position in GLD at 89.
Silver
Silver dissapointed from entering a weekly buy. Missed by a narrow margin. Not sure if that's a red flag for Gold or if it's just lagging behind gold. No positions here.
Euro
The Euro is on a counterend sell i.e a correction on the weekly charts. The 8 EMA continues to resides above the 34 EMA and the weekly trend reamins up. But we marginally failed to get a continuation buy on Euro, thus putting it still in the correction camp. Again whether this non-confirmation remains a red flag for Gold remains to be seen. Interestingly the ETF FXE issued a buy. Maybe the ETF folks are over enthusiastic here. We shall see..
No positions here.
Financials
XLF remains on a weekly continuation sell from last week. XLF needs to take out 28 to invalidate this signal. I remain long SKF from 101 last week.
S&P
The weekly trend continues to remain down on the S&P. 8 EMA below 34 EMA. We are in a large correction in a downtrend. But a couple of more weeks of upside action could turn the weekly trend up. ST continues to confound me. Everyday looks like a top, only to be taken out by a surreptitious slow rally. Typical of a trending market. My system says Friday was a ST top, but again the late day OPEX shenanigan put a damper on that signal. Next weeks things should get clearer.
No positions here. Only daytrading.
OIL
WOW. The strong uptrend on weekly charts continues. DUG seems to be the darling of the masses, just like QID was in 2006, making fresh lows day after day. But the enthusiasm of the OIL bears remains unfazed. It remains to be seen, if finally the OIL bears get the much needed correction or just get blown out by the charging bull. No easy trades in this market at all.
No positions here.
Sunday, May 11, 2008
IT and ST update
In my IT update on April 12, i was looking for an SPX target in the 1400-1420 range. On April 22, i thought we made a top at 1395. But i was wrong. The market inched higher into 1422 area. Now based on Friday's action, we have cracked the ST uptrend from the 4/15 lows. My ST system (daily) is now on a sell, which means i will be shorting rallies here.
Intermediate term has two scenarios here.
Scenario 1: Now the key IT pivot here is SPX 1324. If 1324 is taken out even on a intraday basis, the IT uptrend is over and we should head down and crack the 3/17/08 lows.
Scenario 2: If the daily charts gets oversold and turns back up without breaking 1324, then we should head higher in another upleg to about 1450-60 area.
LT we remain in a bear market, all this huge rallies not withstanding.
LT - Down
IT - Up
ST - Down
Intermediate term has two scenarios here.
Scenario 1: Now the key IT pivot here is SPX 1324. If 1324 is taken out even on a intraday basis, the IT uptrend is over and we should head down and crack the 3/17/08 lows.
Scenario 2: If the daily charts gets oversold and turns back up without breaking 1324, then we should head higher in another upleg to about 1450-60 area.
LT we remain in a bear market, all this huge rallies not withstanding.
LT - Down
IT - Up
ST - Down
Tuesday, April 22, 2008
IT update
The ST uptrend from March 08 lows likely ended today. Both the NYSE breadth and Vol MCOs have hooked down. The Nasdaq breadth MCO has crossed below the zero line and turned the summation down. The daily momentum on SPX has also turned down. The wave pattern looks complete.
The last rally from 4/15 lows has the signature of a sucker rally. Look at the 10 day SMA of the adv-decl on NYSE. It severely diverged as we made new highs.

Will we go for another high with triple divergence ? Always possible, but i am not betting my money on it. Triple divergences on daily charts happen when the markets are in a strong primary uptrend like last summer. Now we are in a bear market. Be prepared for out of the blue declines.
Good luck
The last rally from 4/15 lows has the signature of a sucker rally. Look at the 10 day SMA of the adv-decl on NYSE. It severely diverged as we made new highs.

Will we go for another high with triple divergence ? Always possible, but i am not betting my money on it. Triple divergences on daily charts happen when the markets are in a strong primary uptrend like last summer. Now we are in a bear market. Be prepared for out of the blue declines.
Good luck
Sunday, April 20, 2008
IT update
In my last update on April 12, i called for an upside target of SPX 1400-1420. I was expecting that target to be tagged in about 2 weeks. But it all happened bloody fast, if you were a bear !. Too far...too fast. Again, feels good to be a technical analyst.
So far there are no technical indications of a top yet. I did get a VST sell at the close on Friday. So expect some weakness come Monday. I don't have any projections for the selloff yet. All big selloffs start with a VST sell. But all VST sells do not necessarily lead to big selloffs.
To call 4/18 as a top, a couple of things need to happen. Firstly the rising NYSE MCOs should hook down and price needs to break below SPX 1357. That selloff should be of a high velocity type. That would be an early indication of the top. Barring that i would still expect the higher end of my projected range which is 1420 to get tagged in the coming days.
Bottomline, hourly is on a sell. Play for what it's worth. Daily uptrend remains intact for now. No need to overanalyze here.
So far there are no technical indications of a top yet. I did get a VST sell at the close on Friday. So expect some weakness come Monday. I don't have any projections for the selloff yet. All big selloffs start with a VST sell. But all VST sells do not necessarily lead to big selloffs.
To call 4/18 as a top, a couple of things need to happen. Firstly the rising NYSE MCOs should hook down and price needs to break below SPX 1357. That selloff should be of a high velocity type. That would be an early indication of the top. Barring that i would still expect the higher end of my projected range which is 1420 to get tagged in the coming days.
Bottomline, hourly is on a sell. Play for what it's worth. Daily uptrend remains intact for now. No need to overanalyze here.
Saturday, April 12, 2008
IT update

In my last IT update on March 24, i noted that the turn in the Weekly CCI above -100 would take us to SPX 1390, the mid-line of the weekly bollinger bands. We tagged the weekly BB which came in around SPX 1386 and got rejected. Feels good as a technical analyst. But the fly in the ointment is that the NYSE MCO spike has not yet displayed negative divergences to call that SPX 1386 as a good top. Also the daily trend as evidenced by the series of higher lows on the daily charts is up. So i would expect another rally here into the SPX 1400-1420 area to finally create the necessary divergences on the MCO and set the stage for the next big decline into the SPX 1160 area.

SPX remains in a very complex corrective wave B correction. This pattern can take myriad of ways to its completion. The wave pattern by itself is totally useless to determine its conclusion. One need to look at the daily price momentum and the internals like the MCOs to determine it's conclusion.
In the end, "Price is king". If we break the 3/31/08 lows, then you can kiss the uptrend a goodbye and start looking to short rallies. For now, the ST remains up and i will be looking to buy dips on oversold conditions. ES could fill the gap at 1321.50, before we begin the next upleg. Or we could also gap-up on Monday and never look back until SPX 1400-20. Either way, i am expecting another upleg.
Good luck all !
Monday, March 24, 2008
IT update - The mother of all interventions !

I am not a fundamental analyst, nor do i beleive fundamental analysis has any value in market timing. But some interesting fundamental events have transpired over the last couple of months - 75 bps emergency but, 50 bps regular meeting cut, 200 billion TSLF facility, another 75 bps regular meeting cut, Bear stern bailout....
And the grand effect - we are still below the Short term DTL (downtrend line). That's some potent intervention, eh ? How many cuts did we require to launch the 1998rally ? Something to ponder.
Ok, now back to TA. The most important technical event as of last weeks close was the Weekly CCI moved back above -100. Usually that's a good indicator of a multi-week rally to occur. The last time it occurred was on 11/30/07, which resulted in a 1.5 weeks of rally before failure. Let's see how long this one lasts.
From a daily chart perspective, we still remain under the ST DTL, which means the daily trend is still down. If we get back above SPX 1345, this week we would end the ST downtrend and the weekly momentum displayed by the CCI should assert itself, meaning a move to about SPX 1390 area (midline of the weekly bollinger bands) should begin. If we fail to take out the SPX 1345 area and encounter a failure, then the downtrend will continue.
If one is stubbornly bearish, the weekly CCI is flashing a big warning to remain flexible.
Monday, March 17, 2008
BSE Sensex (India) LT sell signal

BSE went into a LT sell on March 14, 2008 based on the weekly close, both from a momentum and e-wave perspective. The weekly MACD dipped below zero and now we have a pattern of lower lows on the weekly and a potentially completed e-wave pattern.
The day U.S markets went into a LT sell on my system was 1/16/2008 ( with the break of 1370, which i published on this blog), BSE was trading at 19,868 then. Today it's under 15000. The LT sell on the U.S markets was a great cue for those long the BSE to exit. March 14 weekly close broke the LT uptrend on BSE. I was out of town over the weekend and could not post the LT sell over the weekend.
This sell signal promises an IT objective of about 12500 (wave A decline) and then a bear market bounce in wave B and then a final flush in wave C below 10000. Once the wave B rally completes, i should be able arrive at more refined projections for wave C.
Now that we are in a bear market as opposed to a IT bear trend, this should lead to softening economic conditions going forward. Also, as long as the LT buy was alive, one could sit on drawdowns and hope for the LT trend to bail them out of the drawdown situations. One could also average down on IT term declines. Now that the LT is on a sell, drawdowns can lead to further drawdowns and averaging down can be a potentially losing strategy. Also now all signals will have to be intrepreted in the context of a bear market.
Friday, February 29, 2008
LT and IT update
My LT indicators remain in a bear zone and i eventually expect SPX to tag SPX 1170 +/- 20 points. No change there.
The IT picture here is very interesting to say the least. I have two counts here.
The first count says we have topped in wave X and about to commence the next big leg down. If this were true, then we should take out the MCO lows of 1/22/08, which is not very far below. My only concern with this count is that the upside wave X did not even tag the mid-line of the bollinger bands on the weekly charts. That's very unusual even for a bear market and is characteristic of an extremely weak market.

My second count says we are close to concluding wave b of X and then another run-up to SPX 1420-30 area (wave c of X) to tag the mid-line of the Bollinger bands on the weekly charts, before the big leg commences. Note that both the NYSE breadth and Vol MCOs took out the 2/22 lows. So it's very likely even with this count that we see further weakness down into SPX 1310-1316area, before the wave c of X begins.

Which count Jose ? I have no idea at this point unless we get more information. E-waves are roadmaps and not trading signals. Watch your hourly indicators for bottoming action before jumping long, even if you beleive in the bullish count. Hourly is decisively down at this point and no buy signals there. If you truly beleive that we are headed to SPX 1430 area, then why the hurry to catch a falling knife ? Wait for a hourly buy which could come 15-20 points above. Missing the bottom 15 points ain't shabby if you are looking for a 100 point trade. Good luck !
The IT picture here is very interesting to say the least. I have two counts here.
The first count says we have topped in wave X and about to commence the next big leg down. If this were true, then we should take out the MCO lows of 1/22/08, which is not very far below. My only concern with this count is that the upside wave X did not even tag the mid-line of the bollinger bands on the weekly charts. That's very unusual even for a bear market and is characteristic of an extremely weak market.

My second count says we are close to concluding wave b of X and then another run-up to SPX 1420-30 area (wave c of X) to tag the mid-line of the Bollinger bands on the weekly charts, before the big leg commences. Note that both the NYSE breadth and Vol MCOs took out the 2/22 lows. So it's very likely even with this count that we see further weakness down into SPX 1310-1316area, before the wave c of X begins.

Which count Jose ? I have no idea at this point unless we get more information. E-waves are roadmaps and not trading signals. Watch your hourly indicators for bottoming action before jumping long, even if you beleive in the bullish count. Hourly is decisively down at this point and no buy signals there. If you truly beleive that we are headed to SPX 1430 area, then why the hurry to catch a falling knife ? Wait for a hourly buy which could come 15-20 points above. Missing the bottom 15 points ain't shabby if you are looking for a 100 point trade. Good luck !
Saturday, January 19, 2008
The big picture ! - LT sell
Prior e-wave projection
Back in Sep 2006, on this blog, i had posted the e-wave projection for the final bull market top as SPX 1620. But given the 3-legged structure from Aug 07 bottom, i was still giving the benefit of doubt for another run-up to SPX 1620 in 2008, to complete the pattern. I was wrong. My LT system issued a sell on Jan 16, which now precludes any run-up to new highs anytime soon. The e-wave failure or truncation resulted in a bull market top at 1576. I missed my projection by about 40 points, which is insignificant for a LT type of projection. It's not about being right or wrong here. Even if i were dead right on my target, i would still have got a LT sell only about 10-15% down from the top. You don't get LT bearish confirmation at the tops.
LT sell

As i posted here on Jan 16 08, my system went to a long term sell after breaking the Aug 07 lows. Some recent history on this LT system.
Nov 2000 - SPX 1365 - LT sell. SPX declined to 768 subsequently.
June 2003 - SPX 988 - LT buy. SPX ran up to 1576 after this LT buy. About 60% run-up.
Jan 16, 08 - SPX 1370 - LT sell.
Now since the last LT buy back in 2003, SPX has had one heck of a bull run of about 60%. Now the LT sell has been generated at about 12% from the top. So giving up 12% of the profits from a 60% run-up is not a bad deal, if one views it from a LT perspective. The LT sell during 2000 was also generated from about 11% from the top.
If one were a ST trader, my ST sell would have gotten one out of the market right near the top on Oct 11 - ST sell posted by me on TT.
http://www.traders-talk.com/mb2/index.php?showtopic=77295&hl=
If one were a IT term trader, my IT sell would have gotten one out of the market at 1480 on Nov 11 - IT sell posted on traders-talk
http://www.traders-talk.com/mb2/index.php?showtopic=78887&hl=
So bottomline, it depends on the timeframe one is trading and how much drawdown one is willing to take. LT signals is of no use to traders. It's mostly for LT investor types.
This LT signal is based on three factors. All three conditions need to be satisfied.
1) My bull-bear indicator moving above zero for LT buy or moving below zero for LT sell.
2) Lower lows on weekly for a LT sell and higher highs on weekly for a LT buy.
3) A potentially completed e-wave pattern.
Amazingly, all the three factors came into play right about at the same time. That's what makes TA fascinating !
E-wave details

I was working with an assumption that we were in a Primary degree wave B from March 03 bottom. Given that i now have a LT sell and a potentially completed wave pattern, i have to now radically alter my wavecount, in the light of newly presented information. Waves are dynamic structures, which evolve over time. Now there is no way, i can call this structure a A-B-C pattern from the Oct 02 lows, without violating all the channel rules and e-wave time rules and compromising on the structural integrity of the wave pattern. I am not going to do that to justify my bias or to stubbornly prove my original thesis. Instead, i am changing my wavecount, that the wave from oct 02 was a Primary degree wave 1 impulse, with a wave 5 extension. So we in a primary degree wave 2 bear trend at this stage, until proven otherwise. The implication is that the Oct 02 bottom was a cycle degree wave 4bottom, which should not be violated for decades to come.
The first thrust (Wave 1) from the Oct 02 bottom generated a MACD reading of -14.3. The subsequent thrust (wave 3) generated a MACD reading of 39.58, which has never been exceed throughout the course of the bull market, even after the huge impulse from mid-2006. That pretty much confirms that 2004 peak was indeed the wave 3. Wave 5 generated a peak MACD reading of 37.27, which diverged negatively with the wave 3 peak, characteristic of wave 5. Now we have a situation where wave 1 < wave 3 < wave 5 which says wave 5 extended.
Price Projections Now typically, impulses once completed, retrace back to wave 4 of a lesser degree, which in this case comes around SPX 1170. The measured move objective for a potential double top at Oct 07 also generates an objective of 1170. So the preliminary price objective for the Primary degree wave 2 should be around SPX 1170 +/- 20 points. Whether further downside projections will be generated, will be determined if and when we get there.
Time Projections
Since there is no clear defined time relationship between wave 1 and wave 2, it's hard to come up with a time projection for wave 2. If it's a violent decline, we could see all this over in about 6-8 months. If it's a slow bleed with deep retracements, it could run all the way into 2010. I am not going to hazard a guess on that.
Signal Status
At this point all my systems from VST to LT remain on a sell. Remember in the context of this LT sell, we will have some large and vicious bear market rallies. But rallies should not make any new bull market highs, but a series of lower tops.
Implications of a LT sell
Now that we are in a bear market as opposed to a IT bear trend, this should lead to softening economic conditions going forward, and possibly a recession. Also, as long as the LT buy was alive, one could sit on drawdowns and hope for the LT trend to bail them out of the drawdown situations. One could also average down on IT term declines. Now that the LT is on a sell, drawdowns can lead to further drawdowns and averaging down can be a potentially losing strategy. Also now all signals will have to be intrepreted in the context of a bear market.
And again the "End of America" and the collapse of the Roman empire arguments will start to take centrestage as the bear market unfolds. The argument about emergence of China and India as the next economic superpowers will start to gain strength. The deflationary collapse and "Great depression" arguments will be accepted and dreaded. Those who hung out on the longwaves.net during the 2002 bottom know pretty well how convincing they look and how wrong they turn out to be. If anything this wave 2 will generate fear levels worse than the bottom of Oct 02. Those fear levels should present an opportunity of lifetime for the wholesalers to pick up the bargains once again, as has always happened in the history. But for the retailers with not that deep pockets, it's prudent to remain patient and let the bear play out and wait for the next LT buy confirmation.
Good luck.
Back in Sep 2006, on this blog, i had posted the e-wave projection for the final bull market top as SPX 1620. But given the 3-legged structure from Aug 07 bottom, i was still giving the benefit of doubt for another run-up to SPX 1620 in 2008, to complete the pattern. I was wrong. My LT system issued a sell on Jan 16, which now precludes any run-up to new highs anytime soon. The e-wave failure or truncation resulted in a bull market top at 1576. I missed my projection by about 40 points, which is insignificant for a LT type of projection. It's not about being right or wrong here. Even if i were dead right on my target, i would still have got a LT sell only about 10-15% down from the top. You don't get LT bearish confirmation at the tops.
LT sell

As i posted here on Jan 16 08, my system went to a long term sell after breaking the Aug 07 lows. Some recent history on this LT system.
Nov 2000 - SPX 1365 - LT sell. SPX declined to 768 subsequently.
June 2003 - SPX 988 - LT buy. SPX ran up to 1576 after this LT buy. About 60% run-up.
Jan 16, 08 - SPX 1370 - LT sell.
Now since the last LT buy back in 2003, SPX has had one heck of a bull run of about 60%. Now the LT sell has been generated at about 12% from the top. So giving up 12% of the profits from a 60% run-up is not a bad deal, if one views it from a LT perspective. The LT sell during 2000 was also generated from about 11% from the top.
If one were a ST trader, my ST sell would have gotten one out of the market right near the top on Oct 11 - ST sell posted by me on TT.
http://www.traders-talk.com/mb2/index.php?showtopic=77295&hl=
If one were a IT term trader, my IT sell would have gotten one out of the market at 1480 on Nov 11 - IT sell posted on traders-talk
http://www.traders-talk.com/mb2/index.php?showtopic=78887&hl=
So bottomline, it depends on the timeframe one is trading and how much drawdown one is willing to take. LT signals is of no use to traders. It's mostly for LT investor types.
This LT signal is based on three factors. All three conditions need to be satisfied.
1) My bull-bear indicator moving above zero for LT buy or moving below zero for LT sell.
2) Lower lows on weekly for a LT sell and higher highs on weekly for a LT buy.
3) A potentially completed e-wave pattern.
Amazingly, all the three factors came into play right about at the same time. That's what makes TA fascinating !
E-wave details

I was working with an assumption that we were in a Primary degree wave B from March 03 bottom. Given that i now have a LT sell and a potentially completed wave pattern, i have to now radically alter my wavecount, in the light of newly presented information. Waves are dynamic structures, which evolve over time. Now there is no way, i can call this structure a A-B-C pattern from the Oct 02 lows, without violating all the channel rules and e-wave time rules and compromising on the structural integrity of the wave pattern. I am not going to do that to justify my bias or to stubbornly prove my original thesis. Instead, i am changing my wavecount, that the wave from oct 02 was a Primary degree wave 1 impulse, with a wave 5 extension. So we in a primary degree wave 2 bear trend at this stage, until proven otherwise. The implication is that the Oct 02 bottom was a cycle degree wave 4bottom, which should not be violated for decades to come.
The first thrust (Wave 1) from the Oct 02 bottom generated a MACD reading of -14.3. The subsequent thrust (wave 3) generated a MACD reading of 39.58, which has never been exceed throughout the course of the bull market, even after the huge impulse from mid-2006. That pretty much confirms that 2004 peak was indeed the wave 3. Wave 5 generated a peak MACD reading of 37.27, which diverged negatively with the wave 3 peak, characteristic of wave 5. Now we have a situation where wave 1 < wave 3 < wave 5 which says wave 5 extended.
Price Projections Now typically, impulses once completed, retrace back to wave 4 of a lesser degree, which in this case comes around SPX 1170. The measured move objective for a potential double top at Oct 07 also generates an objective of 1170. So the preliminary price objective for the Primary degree wave 2 should be around SPX 1170 +/- 20 points. Whether further downside projections will be generated, will be determined if and when we get there.
Time Projections
Since there is no clear defined time relationship between wave 1 and wave 2, it's hard to come up with a time projection for wave 2. If it's a violent decline, we could see all this over in about 6-8 months. If it's a slow bleed with deep retracements, it could run all the way into 2010. I am not going to hazard a guess on that.
Signal Status
At this point all my systems from VST to LT remain on a sell. Remember in the context of this LT sell, we will have some large and vicious bear market rallies. But rallies should not make any new bull market highs, but a series of lower tops.
Implications of a LT sell
Now that we are in a bear market as opposed to a IT bear trend, this should lead to softening economic conditions going forward, and possibly a recession. Also, as long as the LT buy was alive, one could sit on drawdowns and hope for the LT trend to bail them out of the drawdown situations. One could also average down on IT term declines. Now that the LT is on a sell, drawdowns can lead to further drawdowns and averaging down can be a potentially losing strategy. Also now all signals will have to be intrepreted in the context of a bear market.
And again the "End of America" and the collapse of the Roman empire arguments will start to take centrestage as the bear market unfolds. The argument about emergence of China and India as the next economic superpowers will start to gain strength. The deflationary collapse and "Great depression" arguments will be accepted and dreaded. Those who hung out on the longwaves.net during the 2002 bottom know pretty well how convincing they look and how wrong they turn out to be. If anything this wave 2 will generate fear levels worse than the bottom of Oct 02. Those fear levels should present an opportunity of lifetime for the wholesalers to pick up the bargains once again, as has always happened in the history. But for the retailers with not that deep pockets, it's prudent to remain patient and let the bear play out and wait for the next LT buy confirmation.
Good luck.
Wednesday, January 16, 2008
LT sell

I will post a detailed update during the weekend. For now, it's suffice to say the break of the Aug lows and my bull-bear market indicator crossing below zero has signalled a LT sell.
Sunday, January 13, 2008
Oh my... !
The decline from July 07 top concluded as 3 waves. The next upleg from Aug 07 to Oct 07 was another 3 wave structure. The subsequent decline from Oct 07 is also a 3 wave structure so far. So no impusive action so far from July 07, from either a bullish or bearish perspective. That's why i give the benefit of doubt to a high level consolidation here.
The most striking feature is the irregular top on Oct 11. Irregular tops are bullish e-wave structures and they resolve upwards after the correction is over. The only way a 3-legged wave can be called the ultimate bull market top is if one subscribes to the truncation theory. If one theorizes that Oct 11 ended in a failure, then we could say that it was a major bull market top. But the truncation theory ends up wrong more than 9 out of 10 times. So it's hard to go with the truncation theory. A failure or truncation means the bearish forces were so overwhelming that the market could not reach it's logical conclusion i.e could not complete it's wave pattern. Now if it were true, then the subsequent decline from Oct 07 top should have been more violent than the rally from Aug 07 bottom. This is not the case as seen from the angle of decline or the time taken to retrace the the rally from Aug bottom. So the truncation theory is pretty hollow!
Now here's the "Oh my...." part.

My momentum indicator which demarcates the bull-bear market stopped right near the zero line as of this week's close. Oh my...
That also coincided with a climactic reversal in the form of penentration of the weekly bollinger bands and a reversal out of it. The BB penetration and reversal have market all the IT bottoms since the bull market begun in 2003. Oh my...
The decline from July 07 top to Aug 07 bottom took 5 weeks. The rally from Aug 07 bottom to Oct 07 top took 9 weeks. That's a total of 14 weeks for A+B. The decline from Oct 07 to date has taken 14 weeks. A+B = C. Oh my....
Can you call the bull dead ? You be the judge ! I am just presenting the TA case for a incomplete bull market.
My ST to IT indicators remain on a sell signal. If we get a strong rally accompanied with strong volume and breadth, then we could generate an IT buy signal next week. If we crap out here yet again, then the bear market case will start strengthening again. The market is currently wearing out both the bulls and bears. The violent snapbacks have killed the stubborn bears. The spectacular rally failures have killed the stubborn bulls. If one thing everyone is sure of in this environment is failures - both rallies and declines. Strong trending moves come out of this kind of environment. Be prepared !
The most striking feature is the irregular top on Oct 11. Irregular tops are bullish e-wave structures and they resolve upwards after the correction is over. The only way a 3-legged wave can be called the ultimate bull market top is if one subscribes to the truncation theory. If one theorizes that Oct 11 ended in a failure, then we could say that it was a major bull market top. But the truncation theory ends up wrong more than 9 out of 10 times. So it's hard to go with the truncation theory. A failure or truncation means the bearish forces were so overwhelming that the market could not reach it's logical conclusion i.e could not complete it's wave pattern. Now if it were true, then the subsequent decline from Oct 07 top should have been more violent than the rally from Aug 07 bottom. This is not the case as seen from the angle of decline or the time taken to retrace the the rally from Aug bottom. So the truncation theory is pretty hollow!
Now here's the "Oh my...." part.

My momentum indicator which demarcates the bull-bear market stopped right near the zero line as of this week's close. Oh my...
That also coincided with a climactic reversal in the form of penentration of the weekly bollinger bands and a reversal out of it. The BB penetration and reversal have market all the IT bottoms since the bull market begun in 2003. Oh my...
The decline from July 07 top to Aug 07 bottom took 5 weeks. The rally from Aug 07 bottom to Oct 07 top took 9 weeks. That's a total of 14 weeks for A+B. The decline from Oct 07 to date has taken 14 weeks. A+B = C. Oh my....
Can you call the bull dead ? You be the judge ! I am just presenting the TA case for a incomplete bull market.
My ST to IT indicators remain on a sell signal. If we get a strong rally accompanied with strong volume and breadth, then we could generate an IT buy signal next week. If we crap out here yet again, then the bear market case will start strengthening again. The market is currently wearing out both the bulls and bears. The violent snapbacks have killed the stubborn bears. The spectacular rally failures have killed the stubborn bulls. If one thing everyone is sure of in this environment is failures - both rallies and declines. Strong trending moves come out of this kind of environment. Be prepared !
Saturday, January 05, 2008
IT sell signal
What a difference a day makes!. The inability of the market to recover after filling the ES 1436 gap and a lack of strong reversal EOD, caused some massive technical failure on weekly charts. Now we have serious momentum failure on the weekly charts. If we break the Nov 26 lows, we would also have to deal with a pattern failure (triangle pattern). The ball is now clearly in the bears court and i am bearish here. No reason whatsoever to be bullish.
So, now are we in a bear market ? Not yet. Not according to my indicators. Not until this indicator crosses below zero.

Don't get me wrong. I am bearish here, but an IT downtrend does not make it a bear market. Aug 04, April 05, Oct 05, June 06 have all had the same kind of momentum breakdown/configuration on the weekly charts. But they all resolved to the upside. The arguments then, were same as now. Internals breaking down, fundamentals (like credit mess, impending derivative implosion, consumer tapped out etc...). The fundmental arguments have no credibility left in so far as calling the bear market, cuz the market has rallied for 4 years in the face the same fundamentals or the fundamental expectations. Now during all those IT bottoms, it was the same sentiment on the message boards and among the market advisors. That any recovery back to the bull side was improbable and the bear market was inevitable. Clearly it was a wrong assumption in all the 4 instances. My indicator and my methodology has kept me on the right side so far and it also takes away any emotional reponse to market action and popular herding behaviour out of the equation.
What will create a bear market here ? IMO, three things need to happen here. The massive larger degree consolidation pattern or the topping pattern, as the case maybe, is yet to be resolved. A break of Aug 07 lows will resolve it to the bear side. A break of Aug lows would mean that we finally have bottoms below bottoms on the weekly chart. That's an unequivocal bear trend. That would also put to rest any bullish e-wave pattern arguments. That would also pull my LT indicator into the bear territory. Right now the jury is still out, but time to be very cautious on long side as the market has a serious chance of a collapse....
So, now are we in a bear market ? Not yet. Not according to my indicators. Not until this indicator crosses below zero.

Don't get me wrong. I am bearish here, but an IT downtrend does not make it a bear market. Aug 04, April 05, Oct 05, June 06 have all had the same kind of momentum breakdown/configuration on the weekly charts. But they all resolved to the upside. The arguments then, were same as now. Internals breaking down, fundamentals (like credit mess, impending derivative implosion, consumer tapped out etc...). The fundmental arguments have no credibility left in so far as calling the bear market, cuz the market has rallied for 4 years in the face the same fundamentals or the fundamental expectations. Now during all those IT bottoms, it was the same sentiment on the message boards and among the market advisors. That any recovery back to the bull side was improbable and the bear market was inevitable. Clearly it was a wrong assumption in all the 4 instances. My indicator and my methodology has kept me on the right side so far and it also takes away any emotional reponse to market action and popular herding behaviour out of the equation.
What will create a bear market here ? IMO, three things need to happen here. The massive larger degree consolidation pattern or the topping pattern, as the case maybe, is yet to be resolved. A break of Aug 07 lows will resolve it to the bear side. A break of Aug lows would mean that we finally have bottoms below bottoms on the weekly chart. That's an unequivocal bear trend. That would also put to rest any bullish e-wave pattern arguments. That would also pull my LT indicator into the bear territory. Right now the jury is still out, but time to be very cautious on long side as the market has a serious chance of a collapse....
Friday, November 30, 2007
Case for an IT bottom
On 11/7 after breaking below my SPX 1480 IT pivot, we had entered a IT downtrend. Now the SPX 1480 has been captured on a weekly closing basis. Coincident with the price close, all my daily and weekly indicators have turned up and based on my weekly indicators i have a IT buy signal at today's close. The daily and weekly are both turning up at the same time, which makes it a combo buy signal, which tend to be powerful signals. Since i cannot fully disclose my system and its rules, here are a few charts to make a case for an IT buy signal.
On the daily charts, this slow MACD has issued a buy signal at the close today.

On the Daily charts, we are coming out of an oversold area, based on this oversold/overbought indicator.

On the weekly charts, the CCI crossed over above -100. We had a nice outside reversal day on the weekly charts. XLF, the beaten down financial sector also had a outside reversal day on the weekly charts.

The NYSE MCO had a nice breadth thrust and the summation is now pointing up. Also note the positive MCO divergences with Aug 07 lows.

Lastly, the 10 day SMA of adv-decl made a nice divergent bottom relative to Aug 07 lows and has now moved above zero.

Now the perversity of the markets should show up it's face next week. I am sure a lot of newsletter writers will be issuing buy signals to their subscribers today. How do you unload all the newly minted bulls ? - Good old stlye shakeout. After a day or two of move to the upside next week, we should see a good sized shakeout after which the IT uptrend should continue. I would expect SPX 1460 to hold on any shakeout/pullback.
On the daily charts, this slow MACD has issued a buy signal at the close today.

On the Daily charts, we are coming out of an oversold area, based on this oversold/overbought indicator.

On the weekly charts, the CCI crossed over above -100. We had a nice outside reversal day on the weekly charts. XLF, the beaten down financial sector also had a outside reversal day on the weekly charts.

The NYSE MCO had a nice breadth thrust and the summation is now pointing up. Also note the positive MCO divergences with Aug 07 lows.

Lastly, the 10 day SMA of adv-decl made a nice divergent bottom relative to Aug 07 lows and has now moved above zero.

Now the perversity of the markets should show up it's face next week. I am sure a lot of newsletter writers will be issuing buy signals to their subscribers today. How do you unload all the newly minted bulls ? - Good old stlye shakeout. After a day or two of move to the upside next week, we should see a good sized shakeout after which the IT uptrend should continue. I would expect SPX 1460 to hold on any shakeout/pullback.
Sunday, November 11, 2007
Bear market - Nah !
The message boards are raging with talk of bear market, recession, Super cycle top et al. Nothing new there. It's what that's been going on over the full length of this bull market.
Emotions aside, i am posting a chart here with an indicator that i use to objectively define a bull and a bear market. Until this indicator turns below zero, there's no bear market, the way i define it. Again, remember this is a long term indicator and should not be used for ST to IT term timing purposes, unless one is ready to take a 15-20% drawdown. Right now we are in a intermediate term correction and it should be respected, if one is trading that timeframe.

Based on this indicator, in the last two decades, there have been three minor bear trends 1987, 1990 and 2000. 1987 and 1990 conincided with minor bear trends and economic softness. 2000 was a major bear market in stocks which coincided with a full blown recession. This indicator signaled a bear market in Nov 2000 and turned back in June 2003, which signalled the end of bear market. It's always better to be late in calling a bear market than earlier. Public memory is short. Those who claim to have called the 2000 top were the same folks who have been calling it since 1995 and some from late 80s. There are a few exceptions who called it in 98 and 99 and were vindicated in 2000. My point is "Don't be eager in calling a bear market" as the bull market topping is multi-year process. It's better to be 6 months late rather a few years earlier as the opportunity cost of not riding the bull market is too much and the associated psychological stress of being early and wrong in calling a top is just not worth it.
Looking at my indicator, during the great bull market of 90s, the first set of divergences started appearing in Oct 1997. We got a decent correction and the Osc moved to new highs. The next set of divergences apeared in July of 1998. We got a big correction and moved to new highs on the Osc in 1999. From July 1999, there were a series of lower low on the Osc with higher highs on indices. The increase in volatility, accompanied by a series of divergences was indicative of a maturing bull cycle. My LT indicators are in a configuration similar to where we were in July-Aug 1999.
Looking at my long term indicators and some divergences on the long term charts, i have to say the BULL market is maturing and in it's final stages. Nothing has changed as far as my LT e-wave count is concerned and i still expect SPX 1800 by 2009, before it's all said and done. My indicators remain in a bull market zone and i have a incomplete wave count to contend with. So the implication is the bull market will continue. Currently we are in a intermediate correction which started on Oct 11. I expect new ATH on SPX once the IT correction is over.
As for the recession talk, it's something that's been going on for the last 4 years. 2004, we were supposed to enter a recession. Then it got moved to 2005. 2006 was supposed to be a no brainer recession. 2007, there was no escape. And here we are in 2007 and the U.S GDP is growing at 3.9%. The emerging markets continue to grow at 9-10%. I am no economic expert. So i will listen to the stock market to signal a recession, instead of listening to the economic professors who have predicted the last few recessions that never occurred!
As for the Super cycle top and Grand Super cycle top and "End of America" arguments, it may not happen in many of our lifetimes.
Emotions aside, i am posting a chart here with an indicator that i use to objectively define a bull and a bear market. Until this indicator turns below zero, there's no bear market, the way i define it. Again, remember this is a long term indicator and should not be used for ST to IT term timing purposes, unless one is ready to take a 15-20% drawdown. Right now we are in a intermediate term correction and it should be respected, if one is trading that timeframe.

Based on this indicator, in the last two decades, there have been three minor bear trends 1987, 1990 and 2000. 1987 and 1990 conincided with minor bear trends and economic softness. 2000 was a major bear market in stocks which coincided with a full blown recession. This indicator signaled a bear market in Nov 2000 and turned back in June 2003, which signalled the end of bear market. It's always better to be late in calling a bear market than earlier. Public memory is short. Those who claim to have called the 2000 top were the same folks who have been calling it since 1995 and some from late 80s. There are a few exceptions who called it in 98 and 99 and were vindicated in 2000. My point is "Don't be eager in calling a bear market" as the bull market topping is multi-year process. It's better to be 6 months late rather a few years earlier as the opportunity cost of not riding the bull market is too much and the associated psychological stress of being early and wrong in calling a top is just not worth it.
Looking at my indicator, during the great bull market of 90s, the first set of divergences started appearing in Oct 1997. We got a decent correction and the Osc moved to new highs. The next set of divergences apeared in July of 1998. We got a big correction and moved to new highs on the Osc in 1999. From July 1999, there were a series of lower low on the Osc with higher highs on indices. The increase in volatility, accompanied by a series of divergences was indicative of a maturing bull cycle. My LT indicators are in a configuration similar to where we were in July-Aug 1999.
Looking at my long term indicators and some divergences on the long term charts, i have to say the BULL market is maturing and in it's final stages. Nothing has changed as far as my LT e-wave count is concerned and i still expect SPX 1800 by 2009, before it's all said and done. My indicators remain in a bull market zone and i have a incomplete wave count to contend with. So the implication is the bull market will continue. Currently we are in a intermediate correction which started on Oct 11. I expect new ATH on SPX once the IT correction is over.
As for the recession talk, it's something that's been going on for the last 4 years. 2004, we were supposed to enter a recession. Then it got moved to 2005. 2006 was supposed to be a no brainer recession. 2007, there was no escape. And here we are in 2007 and the U.S GDP is growing at 3.9%. The emerging markets continue to grow at 9-10%. I am no economic expert. So i will listen to the stock market to signal a recession, instead of listening to the economic professors who have predicted the last few recessions that never occurred!
As for the Super cycle top and Grand Super cycle top and "End of America" arguments, it may not happen in many of our lifetimes.
Wednesday, October 24, 2007
LT market thoughts - Update 2
Last i updated my LT thoughts here
http://nav-ta.blogspot.com/2007_07_15_archive.html
While the overall outlook and direction of the long term hasn't changed a bit, i will have to change the labelling a bit. LT remains very bullish at least until late 2008-2009 as i have been saying for the last couple of years.
Intially my guess was the large correction from the July 2007 top was a X-wave. If it was a X-wave, SPX should not have made new ATH after the Aug 07 bottom, rather should have made a lower high vis-a-vis the July 07 highs and made a trip down to about SPX 1320. That would have made it structurally look like a wave-X and also would have satisfied the price and time requirements. Now the entire correction from July 07 to Aug 07 looks so small in terms of both price and time (relative to the entire rally from March 2003 to July 2007), one can conclude that rally from June 2006 is extending. That means the intermedite wave C of Primary degree wave C is still extending. So to put it simply Aug 07 was a wave 2 bottom of the intermediate term wave C from June 2006. As simple as that. If it's not clear, take a look at the chart.
Now that brings us to the projections. If wave C = 1.618 * wave A, then we should achieve SPX 1830 by late 2008 to early 2009. SPX 1850 also happens to be the 1.38 times Fib extension target for the entire decline from 2000-2002. So we should top the bull market from 2003, somewhere in the vicinity of SPX 1830-1850. Now that's the minimum projection. It could be higher if the waves extend. I will update as time goes by. By 2009, most of the bearish caucus would have been worn out both psychologically and financially, paving the way for a huge bear market in Primary degree wave C.
Again, since we are now dealing with wave iii of an intermediate wave 3, it ain't gonna be a pony ride. It's gonna be a bucking bronco, with scary volatility. The ST volatility cannot be predicted with just e-waves alone, but by supplementing it with various ST technical tools. But overall the LT direction remains up and is very bullish at this point, based on the wave structure.

My last LT update can be found here.
http://nav-ta.blogspot.com/2007_07_15_archive.html
While the overall outlook and direction of the long term hasn't changed a bit, i will have to change the labelling a bit. LT remains very bullish at least until late 2008-2009 as i have been saying for the last couple of years.
Intially my guess was the large correction from the July 2007 top was a X-wave. If it was a X-wave, SPX should not have made new ATH after the Aug 07 bottom, rather should have made a lower high vis-a-vis the July 07 highs and made a trip down to about SPX 1320. That would have made it structurally look like a wave-X and also would have satisfied the price and time requirements. Now the entire correction from July 07 to Aug 07 looks so small in terms of both price and time (relative to the entire rally from March 2003 to July 2007), one can conclude that rally from June 2006 is extending. That means the intermedite wave C of Primary degree wave C is still extending. So to put it simply Aug 07 was a wave 2 bottom of the intermediate term wave C from June 2006. As simple as that. If it's not clear, take a look at the chart.
Now that brings us to the projections. If wave C = 1.618 * wave A, then we should achieve SPX 1830 by late 2008 to early 2009. SPX 1850 also happens to be the 1.38 times Fib extension target for the entire decline from 2000-2002. So we should top the bull market from 2003, somewhere in the vicinity of SPX 1830-1850. Now that's the minimum projection. It could be higher if the waves extend. I will update as time goes by. By 2009, most of the bearish caucus would have been worn out both psychologically and financially, paving the way for a huge bear market in Primary degree wave C.
Again, since we are now dealing with wave iii of an intermediate wave 3, it ain't gonna be a pony ride. It's gonna be a bucking bronco, with scary volatility. The ST volatility cannot be predicted with just e-waves alone, but by supplementing it with various ST technical tools. But overall the LT direction remains up and is very bullish at this point, based on the wave structure.

My last LT update can be found here.
Sunday, September 09, 2007
E-wave count
On Sep 1, wrote...
Bullish argument is different and bullish cheerleading and talking positions that happen on message boards are different. Once a weekly buy gets generated, we don't go to the sky directly, like many to-da-moon theorists opine. There are many hiccups on the way and some very scary. Markets are perverse. The first buy on any timeframe generally resolves in the opposite direction. It's for a simple reason, cuz every amateur joe is aware of that and every guru and newsletter writers keep pounding on those facts. That's what causes the amateur traders to come and regurgitate some popular guru opinion on message boards. Now guess what the pros do. They fade that common perception, instill fear by scary selloff, get everyone lean on the wrong side, make them disbeleive their gurus, and then take off.
What's the trade for a ST swing trader (houry swing trader) here ? - IMO it's a unwavering short
Before i proceed, i just want to say that i will not be posting any of my VST stuff on this blog. It's hard for me to continually update this blog during the trading day. Those interested in my VST stuff or trades, i will be posting them on traders-talk.com. My orginal intention was to only post IT and LT thoughts on this blog, and i will stick with that.

So the selloff came like a clockwork. What's next ? I see two possible wave counts at this juncture. Those who make fun of alternate counts firstly don't understand the basic principle of TA, which is probabilistic prediction of future prices. The primary wavecount is that wave c of an irregular flat ended on friday and we take off on Monday without looking back. The only fly in the ointment is that we broke that channel on an hourly closing basis on Friday, which makes me wonder if the market wants to probe lower levels ( SPX 1420), which is my alternate count. Which one ? At this point, i have no idea. We'll know the answers on Monday.
If the primary count is true, we are headed to SPX 1560 for the wave C up. If the alternate count is true, the price projection for wave C would be around 1530. Timewise, i am looking for mid-october for this price projection.
Goog luck trading everyone !
Bullish argument is different and bullish cheerleading and talking positions that happen on message boards are different. Once a weekly buy gets generated, we don't go to the sky directly, like many to-da-moon theorists opine. There are many hiccups on the way and some very scary. Markets are perverse. The first buy on any timeframe generally resolves in the opposite direction. It's for a simple reason, cuz every amateur joe is aware of that and every guru and newsletter writers keep pounding on those facts. That's what causes the amateur traders to come and regurgitate some popular guru opinion on message boards. Now guess what the pros do. They fade that common perception, instill fear by scary selloff, get everyone lean on the wrong side, make them disbeleive their gurus, and then take off.
What's the trade for a ST swing trader (houry swing trader) here ? - IMO it's a unwavering short
Before i proceed, i just want to say that i will not be posting any of my VST stuff on this blog. It's hard for me to continually update this blog during the trading day. Those interested in my VST stuff or trades, i will be posting them on traders-talk.com. My orginal intention was to only post IT and LT thoughts on this blog, and i will stick with that.

So the selloff came like a clockwork. What's next ? I see two possible wave counts at this juncture. Those who make fun of alternate counts firstly don't understand the basic principle of TA, which is probabilistic prediction of future prices. The primary wavecount is that wave c of an irregular flat ended on friday and we take off on Monday without looking back. The only fly in the ointment is that we broke that channel on an hourly closing basis on Friday, which makes me wonder if the market wants to probe lower levels ( SPX 1420), which is my alternate count. Which one ? At this point, i have no idea. We'll know the answers on Monday.
If the primary count is true, we are headed to SPX 1560 for the wave C up. If the alternate count is true, the price projection for wave C would be around 1530. Timewise, i am looking for mid-october for this price projection.
Goog luck trading everyone !
Wednesday, September 05, 2007
Morning thoughts - 9/5/07
The large gap-down on ES, which is currently trading at 1479 will most certainly push my 120-min indicators to a sell at the open. So the trade is "Swing short". Since i would need a large stop of about 20 points to take this trade, i will wait for some sort of bounce to develop and incrementally start building a swing short position.
1:00 Est update
Something doesn't seem right here to short this market. The market was overbought yesterday on the hourly. It was all reset with just one gap-down. Now the hourly momentum is turning back up from oversold levels and the 60-min uptrend is still intact. That's generally a bear-trap. I went long some ETFs and options around SPX 1473 levels. If we break below intraday lows, then i am wrong and will flip short.
1:00 Est update
Something doesn't seem right here to short this market. The market was overbought yesterday on the hourly. It was all reset with just one gap-down. Now the hourly momentum is turning back up from oversold levels and the 60-min uptrend is still intact. That's generally a bear-trap. I went long some ETFs and options around SPX 1473 levels. If we break below intraday lows, then i am wrong and will flip short.
Tuesday, September 04, 2007
9/4/07 - Closing thoughts
As i posted in my morning thoughts, an hourly close above SPX 1484 would cause the market to challenge the next zone of resitance, which currently lies between SPX 1505 and 1512. The ideal target would be SPX 1512. But my experience has been, when the message boards are all abuzz with the same targets, it generally gets undershot or vastly overshot.
It was a good daytrading day on the long side. As for the short swing setup that i was expecting, it just did not materialize.
This market is very strong. The NYSE breadth MCO made another new highs today. This is telling us in no uncertain terms that any pullback that comes along should be bought. Remember for a swing long, we need a selloff, just like a swing short requires a rally. The selloff could be a shallow one in terms of price, but needs to be deep in terms of oscillators. Until that occurs, going swing long at these levels is a sure recipe for a whipsaw. Based on my indicators, we are somewhere around 80-90% done for this hourly swing. Tommorow 10:30 Est could generate some short setup. We'll see...
With all the hoopla out there, the daily trend on SPX still remains down. The hourly and 120-min trends are up, which is what is driving this swing. Blindly shorting a market whose 120-min trend is up, just because the daily trend is down, is plain dangerous. Patience is required here for shorts.
For now, i will daytrade the long side and will be on a lookout to short for a swing trade, when the setup arrives. I will post it real-time here, when that happens.
Good luck.
It was a good daytrading day on the long side. As for the short swing setup that i was expecting, it just did not materialize.
This market is very strong. The NYSE breadth MCO made another new highs today. This is telling us in no uncertain terms that any pullback that comes along should be bought. Remember for a swing long, we need a selloff, just like a swing short requires a rally. The selloff could be a shallow one in terms of price, but needs to be deep in terms of oscillators. Until that occurs, going swing long at these levels is a sure recipe for a whipsaw. Based on my indicators, we are somewhere around 80-90% done for this hourly swing. Tommorow 10:30 Est could generate some short setup. We'll see...
With all the hoopla out there, the daily trend on SPX still remains down. The hourly and 120-min trends are up, which is what is driving this swing. Blindly shorting a market whose 120-min trend is up, just because the daily trend is down, is plain dangerous. Patience is required here for shorts.
For now, i will daytrade the long side and will be on a lookout to short for a swing trade, when the setup arrives. I will post it real-time here, when that happens.
Good luck.
Morning thoughts...
We did not get a 120-min sell at 10:30 Est CIT. So i will have to wait, until a proper setup arrives to short this market. Will continue to remain flat until such setup arrives. An hourly close above SPX 1484, then the next resistance would be SPX 1500-1505.
Saturday, September 01, 2007
A swing trader's case
I am expecting a selloff next week and it should start from the get-go on Tuesday. My expectation is for a test or a slight break of the 8/28 lows. 30-min, 60-min, 120-min momentum were all flashing warning signs on Friday, with 30-min already on a sell. Had it not been for the long weekend, i would shorted the close for a swing trade.
The bullish argument certainly has merit here. We have seen that massive breadth spike on the NYSE MCO. Now the NYSE 5% and 10% components are above zero. The weekly CCI is above -100. As of the close of this week, we got "All clear" signal for IT longs for the first time since 8/16 lows.
Bullish argument is different and bullish cheerleading and talking positions that happen on message boards are different. Once a weekly buy gets generated, we don't go to the sky directly, like many to-da-moon theorists opine. There are many hiccups on the way and some very scary. Markets are perverse. The first buy on any timeframe generally resolves in the opposite direction. It's for a simple reason, cuz every amateur joe is aware of that and every guru and newsletter writers keep pounding on those facts. That's what causes the amateur traders to come and regurgitate some popular guru opinion on message boards. Now guess what the pros do. They fade that common perception, instill fear by scary selloff, get everyone lean on the wrong side, make them disbeleive their gurus, and then take off.
Any professional swing trader worth his salt would not base his ST trades on IT indicators. One has to trade the timeframe of one's chosing. What's the trade for a ST swing trader (houry swing trader) here ? - IMO it's a unwavering short, unless there is a monster gap-up on Tuesday. So barring a big gap-up on Tuesday, i will be shorting this market for a swing trade.
Will try to update my blog on a regular basis going forward.
Good luck everyone.
The bullish argument certainly has merit here. We have seen that massive breadth spike on the NYSE MCO. Now the NYSE 5% and 10% components are above zero. The weekly CCI is above -100. As of the close of this week, we got "All clear" signal for IT longs for the first time since 8/16 lows.
Bullish argument is different and bullish cheerleading and talking positions that happen on message boards are different. Once a weekly buy gets generated, we don't go to the sky directly, like many to-da-moon theorists opine. There are many hiccups on the way and some very scary. Markets are perverse. The first buy on any timeframe generally resolves in the opposite direction. It's for a simple reason, cuz every amateur joe is aware of that and every guru and newsletter writers keep pounding on those facts. That's what causes the amateur traders to come and regurgitate some popular guru opinion on message boards. Now guess what the pros do. They fade that common perception, instill fear by scary selloff, get everyone lean on the wrong side, make them disbeleive their gurus, and then take off.
Any professional swing trader worth his salt would not base his ST trades on IT indicators. One has to trade the timeframe of one's chosing. What's the trade for a ST swing trader (houry swing trader) here ? - IMO it's a unwavering short, unless there is a monster gap-up on Tuesday. So barring a big gap-up on Tuesday, i will be shorting this market for a swing trade.
Will try to update my blog on a regular basis going forward.
Good luck everyone.
Monday, August 20, 2007
Retest time ?
I will keep it simple. As i commented in my last post, we found support in the SPX 1360-90 area and bounced. Is the bounce for real ? Maybe !. But so far there's no evidence that the bottom is in. I need to see the weekly CCI move back above -100 and the NYSE MCO 5% and 10% components move above zero to assert a traedable bottom has been seen. We should know the answer to that in about a week.Right now it's retest time and i would expect at least a test of 1410-20 area sometime this week. The "Fed bottom" (8/16) should not be violated in any case here, which would be very bearish. Even if we violate the 8/16 bottom by a tick, the next target would be SPX 1320-30. So essentially we remain in a volatile environment, where one could be a genius one day and the monkey the next day. Will continue to play both sides, with a bearish slant this week.
Thursday, August 16, 2007
E-wave count with 9 month cycles
I am no cycle expert and the only cycle that i follow is the 9 month cycle. The last wave B bottom in June 2006 was a 9 month cycle bottom off of which this wave C impulse began, based on my phasing. Given that we have seen the largest monthly candle since the rally begun in 2003, it is safe to conclude that Phase I of the bull (A-B-C) is now complete. What follows the wave C is the wave X, in a complex correction. March 2007 was the second 9 month cycle bottom since June 2006, when we concluded the mini-panic. The next 9 month cycle is ideally due around Dec 2007.

If my count is right, we should find a good traedable bottom soemtime this week or early next week in the SPX 1360-1390 area, which should conclude wave A of X and begin a wave B of X bounce. Wave B of X bounce should consume roughly 10 weeks into late Oct 2007 and then a wave C of X decline into Dec 2007, which should conclude in the SPX 1320-1330 area (near the wave b channel top). Once the wave X concludes, we should begin another multi-year advance into 2009 (phase II of bull market).
In case we go straight up from here and take out the July highs on SPX, then it means that wave X already bottomed and phase II of bull has already begun. That would also mean my 9 month cycle phasing is wrong. It will be interesting next few months....

If my count is right, we should find a good traedable bottom soemtime this week or early next week in the SPX 1360-1390 area, which should conclude wave A of X and begin a wave B of X bounce. Wave B of X bounce should consume roughly 10 weeks into late Oct 2007 and then a wave C of X decline into Dec 2007, which should conclude in the SPX 1320-1330 area (near the wave b channel top). Once the wave X concludes, we should begin another multi-year advance into 2009 (phase II of bull market).
In case we go straight up from here and take out the July highs on SPX, then it means that wave X already bottomed and phase II of bull has already begun. That would also mean my 9 month cycle phasing is wrong. It will be interesting next few months....
Wednesday, August 15, 2007
Bottom spotter fails
I posted the bottom spotter signal here a few days back. It's only appropriate for me to update it, since it failed. The signal failed when it took out the Aug 6 lows. Now we have a open ended risk again here with that broad area of support into focus again - SPX 1360-1410.
I see two possibilites here. A washout move i.e a drop of 30-50 SPX points today and a reversal, which would create a nice IT bottom. Instead if we begin a sharp rally from the get go, then a ST low will be confirmed setting the stage for a couple of weeks of rally and then another retest probably in late Sep or Oct. Which one ? It's too early to say. I would prefer a washout here, in which case i would load up on LEAP calls heavily. But then, everyone wants it. Markets are perverse.
All said and done, we continue to remain in a LT bull market. Nothing has changed in that regard. The only sectors currently in a bear market are HGX and REITs. I woudn't touch these sectors even with a 10 foot pole, at this stage of the game.
I see two possibilites here. A washout move i.e a drop of 30-50 SPX points today and a reversal, which would create a nice IT bottom. Instead if we begin a sharp rally from the get go, then a ST low will be confirmed setting the stage for a couple of weeks of rally and then another retest probably in late Sep or Oct. Which one ? It's too early to say. I would prefer a washout here, in which case i would load up on LEAP calls heavily. But then, everyone wants it. Markets are perverse.
All said and done, we continue to remain in a LT bull market. Nothing has changed in that regard. The only sectors currently in a bear market are HGX and REITs. I woudn't touch these sectors even with a 10 foot pole, at this stage of the game.
Friday, August 10, 2007
The bottom is in !
Odss are about 80% that a major bottom is in as of 8/10/07 close. The fear mongering by the media has reached epic proportions. Massive fear levels as measured by the VIX. The most important divergence showed up on Friday, for keen observers of the market, when the VIX made new highs, but the SPX failed to take out the 8/6/07 lows. Now my call for a bottom here is not based on sentiment (although it's highly supportive), but based on pure technical analysis.
I have two charts here.

Let's look at the first chart of SPX between 1991 and 2000, which was a major bull market. I am using 1991 as a starting point because that was the beginning of the bull market based on my weekly momentum work. From a price perspective 1987 was the bottom, but from a weekly momentum perspective, 1991 was the bottom. The momentum confirmation for the bull run came only during 1991. There were three instances, during this period, when the weekly CCI on SPX went below -200. Once the CCI hooked back above -200, a bottom was confirmed and the market never took out those lows again, except 1998. A hook back above -200 is a prelimnary confirmation and is reserved for aggressive bottom pickers. A more solid confirmation comes when the weekly CCI hooks above -100. 3 out of 4 times, the -200 hook marked the bottom. That's 75% odds, between 1991 and 2000 !

Now let's look at the second chart. 2000-2003 was a major bear market. There were two instances during this period when the weekly CCI went below -200 and hooked up. In both the cases, after the CCI hooked-up above -200, the hook-up was a fakeout and there were serious price retests. So during the bear phase, the hookups failed with 100% odds.
Now during the 2003-2007 bull market, there have been two instances when the CCI went below -200 and hooked up. 2005 and now in 2007. 2005 hook-up, the market never looked back.
So the bottomline is, during the bullmarkets, looking at about 16 years of price history, this signal has suceeded 4 of 5 times. That's 80% odds of marking a bottom. During the bear phase, it has 100% odds of failure. Given that the weekly 8 EMA is still above the 34 EMA on the weekly charts and we have classic bottoms above bottoms on the weekly charts, it's undeniable that we are in a major bull market. So i am sticking my neck out and calling 8/10/07 as a major bottom. I could be wrong, but that's what my work says. Since it's only 80% odds (and not 100%), have stops in place, just in case....
As for the VST, i have a weak countertrend buy from friday, which i posted on traders-talk.com. It better be a weak buy, coming out of a major panic low.
I have two charts here.

Let's look at the first chart of SPX between 1991 and 2000, which was a major bull market. I am using 1991 as a starting point because that was the beginning of the bull market based on my weekly momentum work. From a price perspective 1987 was the bottom, but from a weekly momentum perspective, 1991 was the bottom. The momentum confirmation for the bull run came only during 1991. There were three instances, during this period, when the weekly CCI on SPX went below -200. Once the CCI hooked back above -200, a bottom was confirmed and the market never took out those lows again, except 1998. A hook back above -200 is a prelimnary confirmation and is reserved for aggressive bottom pickers. A more solid confirmation comes when the weekly CCI hooks above -100. 3 out of 4 times, the -200 hook marked the bottom. That's 75% odds, between 1991 and 2000 !

Now let's look at the second chart. 2000-2003 was a major bear market. There were two instances during this period when the weekly CCI went below -200 and hooked up. In both the cases, after the CCI hooked-up above -200, the hook-up was a fakeout and there were serious price retests. So during the bear phase, the hookups failed with 100% odds.
Now during the 2003-2007 bull market, there have been two instances when the CCI went below -200 and hooked up. 2005 and now in 2007. 2005 hook-up, the market never looked back.
So the bottomline is, during the bullmarkets, looking at about 16 years of price history, this signal has suceeded 4 of 5 times. That's 80% odds of marking a bottom. During the bear phase, it has 100% odds of failure. Given that the weekly 8 EMA is still above the 34 EMA on the weekly charts and we have classic bottoms above bottoms on the weekly charts, it's undeniable that we are in a major bull market. So i am sticking my neck out and calling 8/10/07 as a major bottom. I could be wrong, but that's what my work says. Since it's only 80% odds (and not 100%), have stops in place, just in case....
As for the VST, i have a weak countertrend buy from friday, which i posted on traders-talk.com. It better be a weak buy, coming out of a major panic low.
Monday, August 06, 2007
LT and IT thoughts
Last time i updated my LT thoughts, i said, we were close to completing the Phase I of the bull market, around SPX 1620 level and by Oct-Nov 2007.
http://nav-ta.blogspot.com/2007/07/lt-market-thoughts-update-1.html
I was wrong on both the counts, in that, the SPX topped at 1555.90 and 3 months ahead of my time projection. The final wave 5 of C, which i thought at time would reach 1620, happened to be a muted one. I posted at that time that the dreaded X-wave would follow after the wave C of Primary degree wave B ends. Given that we have seen the largest monthly bar after the rally begun in 2003, i have no doubts that we are already in that wave X.
It's hard to pinpoint a target with accuracy at this point as to where the wave X would end. My preliminary guess would be around SPX 1360-1410, based on how the wave is unfolding. We still need to see a reaction on the weekly charts that fails, to come up with a proper price projection low for this wave X.
From a LT perspective this bull market is far from over. In fact, if anything the bear market of 2007 is coming close to an end. Yes we may have another month or so pain and another 50-100 SPX points downside. But a major bull market (phase II and final phase of the bull market from 2003) should begin after that.

Looking at the weekly charts, we have seen the most intense downside momentum since 1994. We know what happened after that. That's right. A reading of -248.78 on SPX weekly on the CCI(14). Now here's what is more important. Even this kind of a nosebleed momentum has not turned the 8 ema below the 34 ema on the weekly charts, keeping the weekly uptrend intact. What does this say ? Two things - PANIC and Absence of any topping process ! Looking at the internal measures, relative to the price damage it's PANIC. The lack of topping process is also evident on the charts itself. A slow topping process would have rolled the 8 ema over and brought it closer to the 34 ema before the big selloff happened. In this case it was panic from day one and so far has shown no signs of any bottoming. That's the characteristic of X-waves. They show no topping action and they come out of the blue.
We have seen the worst of the internals. The internal and the momentum low for the market is in. Looking at the daily charts, we are approaching a ST low. We should rally here for a couple weeks and then dive off the cliff to a climactic price low. That should end the quick and dirty bear market of 2007. I expect phase II of the bull market into 2009-2010 thereafter. We'll see...
http://nav-ta.blogspot.com/2007/07/lt-market-thoughts-update-1.html
I was wrong on both the counts, in that, the SPX topped at 1555.90 and 3 months ahead of my time projection. The final wave 5 of C, which i thought at time would reach 1620, happened to be a muted one. I posted at that time that the dreaded X-wave would follow after the wave C of Primary degree wave B ends. Given that we have seen the largest monthly bar after the rally begun in 2003, i have no doubts that we are already in that wave X.
It's hard to pinpoint a target with accuracy at this point as to where the wave X would end. My preliminary guess would be around SPX 1360-1410, based on how the wave is unfolding. We still need to see a reaction on the weekly charts that fails, to come up with a proper price projection low for this wave X.
From a LT perspective this bull market is far from over. In fact, if anything the bear market of 2007 is coming close to an end. Yes we may have another month or so pain and another 50-100 SPX points downside. But a major bull market (phase II and final phase of the bull market from 2003) should begin after that.

Looking at the weekly charts, we have seen the most intense downside momentum since 1994. We know what happened after that. That's right. A reading of -248.78 on SPX weekly on the CCI(14). Now here's what is more important. Even this kind of a nosebleed momentum has not turned the 8 ema below the 34 ema on the weekly charts, keeping the weekly uptrend intact. What does this say ? Two things - PANIC and Absence of any topping process ! Looking at the internal measures, relative to the price damage it's PANIC. The lack of topping process is also evident on the charts itself. A slow topping process would have rolled the 8 ema over and brought it closer to the 34 ema before the big selloff happened. In this case it was panic from day one and so far has shown no signs of any bottoming. That's the characteristic of X-waves. They show no topping action and they come out of the blue.
We have seen the worst of the internals. The internal and the momentum low for the market is in. Looking at the daily charts, we are approaching a ST low. We should rally here for a couple weeks and then dive off the cliff to a climactic price low. That should end the quick and dirty bear market of 2007. I expect phase II of the bull market into 2009-2010 thereafter. We'll see...
Saturday, July 28, 2007
Approaching a major bottom.....

Let's establish the context first. On the weekly chart of the E-mini S&P 500, the bear market started in the fall of 2000 when the weekly MACD crossed below the zero line. The bear market ended in the summer of 2003, when the weekly MACD crossed over to the upside.That establishes the bull-bear context. Right now we are in the middle of a major bull market, notwithstanding expert opinions that it may have ended. The weekly MACD is still high up in the air, to call it done. For it to crossover below zero and enter a bear market, it takes many more months of bearish price action.
Before we extrapolate the trend and say the bear market has begun, let's ask, where exactly are we in the trend. The weekly momentum as measured by the CCI is now below 200. In all the instances, during the bull context, when the weekly CCI entered the -200 zone, the market bottomed within 1-2 weeks and the eventual price low was 10-20 SPX below the price low established during the week the CCI entered below 200. Even during the bear market (except one instance in 2001), the -200 CCI has marked major market bottoms. So again, we might be within 10-20 SPX points away from a major price bottom. Expect retests of this weekly low, a couple of times, over the next 1-2 weeks. Or maybe this time is different.....
Sunday, July 15, 2007
LT market thoughts - Update 1
Back in 2007, i wrote about my LT market thoughts on this blog. What more appropriate time to review it, given that we made all time highs on SPX today.
http://nav-ta.blogspot.com/2006/09/long-term-market-thoughts.html
I wrote then...
We should begin a persistant market advance from 2007 in a wave C upmove. Wave C should take us to about SPX 1620 (if wave A = wave C) or about SPX 1860 (if wave C = 1.618 * wave A), before this BULL market tops out, most likely by late 2008 to early 2009. By then, most of the bearish caucus will have worn out/capitulated leading the way for a primary degree wave C decline.
My projection for S&P was 1620 by 2009. The wall of worry at that time for the market to climb, was pretty high, based on the usual factors - perceived deteriorating fundamentals, P/E ratio, declining housing market, Derivative implosion, Credit implosion etc. My forecast at that time would have probably brought out a chuckle to many. Once we broke above SPX 1388 on the weekly charts, it was clear that the market had begun a major advance out of the wave B sideways flag from 2004-2006. SPX cash 1388 was the wave B channel top, at the time we broke out above it. That signalled that we were in a intermediate term wave C. I was right on the price, but wrong on the timeframe. I was expecting this wave C to conclude somewhere in 2009 reaching it's projection of SPX 1620. Why do i keep talking about 2009 ? It's based on the time requirements for the primary degree wave B. If primary degree wave C were to make proper divergences on the monthly charts in the future, wave B should consume at least more than twice the amount of time consumed by wave A.
Based on how fast this wave structure unfolded towards it target, it now appears that SPX will reach 1620 by Oct-Nov 2007. This is very bullish long term. This only means that the targets were acheived ahead of time, and hence higher targets are now projected for 2009-2010 timeframe. So the only conclusion as a wave analyst at this time would be, we are close to concluding the Phase I of the bull market from 2003 (intermediate degree A-B-C rally), which should ideally happen around Oct-Nov 2007.

What follows an A-B-C is an X-wave. X-waves are rogue waves. They come out of the blue without any appropriate technical warnings. They also happen to appear when the tecnicals look the most bullish. They don't surface up on any divergent/weakening technicals. If i were to speculate, event risk would start growing after Nov 2007, based on the wave structure. Another hedge fund debacle, subprime lending crises, yen carry trade - Heck who knows ?. Once this wave X ends somewhere in 2008, another large persistent advance into 2009-2010 should take the market to another bull market high. How high ? I don't have any projections at this point, as that would enter the realm of crystalballing or astrology. Until we know how deep the wave X will turn out to be, it's impossible to make any meaningful projections. Ideally wave X should bottom around the SPX 1320 area and in no case below the 2006 4-year cycle bottom at SPX 1219. If the wave X happens to be based on an event, i am positive that Mr Bernanke would open the floodgates of liquidity again. The man who proclaimed that deflation is impossible in a fiat regime, will most certainly not allow it to happen without fighting it tooth and nail !. That should create a hyperinflationary advance into 2009-2010 where both the commodities and the stock market should go nuts, setting the stage for a deflationary collapse into 2016 (a.k.a Primary degree wave C).
I wrote then...
Bull markets do not begin when the economy is in a state of utopia. It needs that constant wall of worry, to keep the majority from participating. I think the housing market decline over the next few years from the mania top of 2005 will provide fresh fodder for the bears to worry and the wall of worry for the bull market to climb. In my opinion, the housing and the deteriorating economic fundamentals going forward will be the hook which will keep the majority from participating in the bull market going forward.
Which is precisely what's been happening. What have we been hearing and reading over the last 9 months ? - Housing, subrpime, blow-up, recession......
I wrote then....
Now will the bears concede defeat if DOW makes ATH ? Bookmark this - DOW ATH will only make the bears more bearish. If DOW ATH were to occur, then the argument will shift to the massive inter-market divergences between the DOW, S&P and the Nasdaq. So the bears will start arguing that Nasdaq and S&P made their secular tops in 2000, but DOW is making it's secular top in 2006. In other words, the bearish sentiment will rise to all time highs, with the all time highs in DOW. Bottomline is as the market advances from here, the sentiment which is already extremely bearish will only start getting even worse. Bears have been arguing that Fed has painted itself into a corner. In reality, it's the bears who have painted themselves into a corner here, if the DOW were to make ATH. They can neither remain bearish nor can they turn bullish. The real capitulation would only come later with ATHs in SPX.
What does the sentiment look like right now ? We made all time highs on the SPX, but hardly any excitement out there. The bear caucus haven't changed a bit. They still keep talking about the sectoral fundamentals such as housing, sub-prime,etc and DOW:GOLD ratio charts or SPX:EURO ratio charts. The most comical and ethically disturbing way of fooling their subscriber base by some permabear gurus, by showing the DOW:GOLD ratio charts continues. Now did these permabear gurus project a DOW:GOLD long term top in 2000 or the price top ? During the 2002 bottom, they were unequivocally talking about DOW 4000 and DOW 400. Yes, they were talking absolute price then. Now the the absolute price projections don't mean anything. It's the ratio stupid ! Wish my grocery bills were ratio adjusted, my home mortage ratio adjusted, my vacation bills ratio adjusted. Talk about vindication.....Oh well ! Well, hate me for saying it like it is. Anyway, i said the real capitualtion would come only after the ATH in SPX. Boy, was i wrong. The LT sentiment only keeps getting worse, while the ST sentiment keeps vacillating.
Now just imagine what would happen to the sentiment, if we see a 200 point decline in SPX ! - That's it...that's the fuel we would need for the next leg of the bull market !
http://nav-ta.blogspot.com/2006/09/long-term-market-thoughts.html
I wrote then...
We should begin a persistant market advance from 2007 in a wave C upmove. Wave C should take us to about SPX 1620 (if wave A = wave C) or about SPX 1860 (if wave C = 1.618 * wave A), before this BULL market tops out, most likely by late 2008 to early 2009. By then, most of the bearish caucus will have worn out/capitulated leading the way for a primary degree wave C decline.
My projection for S&P was 1620 by 2009. The wall of worry at that time for the market to climb, was pretty high, based on the usual factors - perceived deteriorating fundamentals, P/E ratio, declining housing market, Derivative implosion, Credit implosion etc. My forecast at that time would have probably brought out a chuckle to many. Once we broke above SPX 1388 on the weekly charts, it was clear that the market had begun a major advance out of the wave B sideways flag from 2004-2006. SPX cash 1388 was the wave B channel top, at the time we broke out above it. That signalled that we were in a intermediate term wave C. I was right on the price, but wrong on the timeframe. I was expecting this wave C to conclude somewhere in 2009 reaching it's projection of SPX 1620. Why do i keep talking about 2009 ? It's based on the time requirements for the primary degree wave B. If primary degree wave C were to make proper divergences on the monthly charts in the future, wave B should consume at least more than twice the amount of time consumed by wave A.
Based on how fast this wave structure unfolded towards it target, it now appears that SPX will reach 1620 by Oct-Nov 2007. This is very bullish long term. This only means that the targets were acheived ahead of time, and hence higher targets are now projected for 2009-2010 timeframe. So the only conclusion as a wave analyst at this time would be, we are close to concluding the Phase I of the bull market from 2003 (intermediate degree A-B-C rally), which should ideally happen around Oct-Nov 2007.

What follows an A-B-C is an X-wave. X-waves are rogue waves. They come out of the blue without any appropriate technical warnings. They also happen to appear when the tecnicals look the most bullish. They don't surface up on any divergent/weakening technicals. If i were to speculate, event risk would start growing after Nov 2007, based on the wave structure. Another hedge fund debacle, subprime lending crises, yen carry trade - Heck who knows ?. Once this wave X ends somewhere in 2008, another large persistent advance into 2009-2010 should take the market to another bull market high. How high ? I don't have any projections at this point, as that would enter the realm of crystalballing or astrology. Until we know how deep the wave X will turn out to be, it's impossible to make any meaningful projections. Ideally wave X should bottom around the SPX 1320 area and in no case below the 2006 4-year cycle bottom at SPX 1219. If the wave X happens to be based on an event, i am positive that Mr Bernanke would open the floodgates of liquidity again. The man who proclaimed that deflation is impossible in a fiat regime, will most certainly not allow it to happen without fighting it tooth and nail !. That should create a hyperinflationary advance into 2009-2010 where both the commodities and the stock market should go nuts, setting the stage for a deflationary collapse into 2016 (a.k.a Primary degree wave C).
I wrote then...
Bull markets do not begin when the economy is in a state of utopia. It needs that constant wall of worry, to keep the majority from participating. I think the housing market decline over the next few years from the mania top of 2005 will provide fresh fodder for the bears to worry and the wall of worry for the bull market to climb. In my opinion, the housing and the deteriorating economic fundamentals going forward will be the hook which will keep the majority from participating in the bull market going forward.
Which is precisely what's been happening. What have we been hearing and reading over the last 9 months ? - Housing, subrpime, blow-up, recession......
I wrote then....
Now will the bears concede defeat if DOW makes ATH ? Bookmark this - DOW ATH will only make the bears more bearish. If DOW ATH were to occur, then the argument will shift to the massive inter-market divergences between the DOW, S&P and the Nasdaq. So the bears will start arguing that Nasdaq and S&P made their secular tops in 2000, but DOW is making it's secular top in 2006. In other words, the bearish sentiment will rise to all time highs, with the all time highs in DOW. Bottomline is as the market advances from here, the sentiment which is already extremely bearish will only start getting even worse. Bears have been arguing that Fed has painted itself into a corner. In reality, it's the bears who have painted themselves into a corner here, if the DOW were to make ATH. They can neither remain bearish nor can they turn bullish. The real capitulation would only come later with ATHs in SPX.
What does the sentiment look like right now ? We made all time highs on the SPX, but hardly any excitement out there. The bear caucus haven't changed a bit. They still keep talking about the sectoral fundamentals such as housing, sub-prime,etc and DOW:GOLD ratio charts or SPX:EURO ratio charts. The most comical and ethically disturbing way of fooling their subscriber base by some permabear gurus, by showing the DOW:GOLD ratio charts continues. Now did these permabear gurus project a DOW:GOLD long term top in 2000 or the price top ? During the 2002 bottom, they were unequivocally talking about DOW 4000 and DOW 400. Yes, they were talking absolute price then. Now the the absolute price projections don't mean anything. It's the ratio stupid ! Wish my grocery bills were ratio adjusted, my home mortage ratio adjusted, my vacation bills ratio adjusted. Talk about vindication.....Oh well ! Well, hate me for saying it like it is. Anyway, i said the real capitualtion would come only after the ATH in SPX. Boy, was i wrong. The LT sentiment only keeps getting worse, while the ST sentiment keeps vacillating.
Now just imagine what would happen to the sentiment, if we see a 200 point decline in SPX ! - That's it...that's the fuel we would need for the next leg of the bull market !
Saturday, July 07, 2007
Use your Oscillators....
Use your Oscillators in a sideways market and the moving averages in a trending market. Anything else, you become the victim of whipsaws. How do you know you are in a sideways market ? I showed this chart to my 6-year old and he says it looks sideways On a serious note though, we aren't trending up until we see bottoms above bottoms on this chart. Right now all we have seen is bottoms below bottoms a.k.a SIDEWAYS-TO-DOWN market.

The last warning on complex bottom was here.
http://nav-ta.blogspot.com/2007/06/going-into-fed-meeting.html
The 120-min buy signal from that day is still intact. But as you see on the charts, we are overbought and rolling over. Once that happens, we need a momentum break to go short. That's what i will be looking for next week.
Consider this a topping area, unless not leaving the last .25 percent is your forte Just kidding. I will start my shorting campaign next week.
A break above 6/20 swing high will start sowing the seeds of doubt in my heart

The last warning on complex bottom was here.
http://nav-ta.blogspot.com/2007/06/going-into-fed-meeting.html
The 120-min buy signal from that day is still intact. But as you see on the charts, we are overbought and rolling over. Once that happens, we need a momentum break to go short. That's what i will be looking for next week.
Consider this a topping area, unless not leaving the last .25 percent is your forte Just kidding. I will start my shorting campaign next week.
A break above 6/20 swing high will start sowing the seeds of doubt in my heart
Friday, June 29, 2007
Bearish shooting star
You gotta love markets. Everyday is different and brings new information and new challenges and excitement. What looked like a bullish certainity going into the Fed meeting, changed completely after 2 hours.
Firstly, the 120-min on NQ and ES is still on a buy, but is in a position to get rejected at the zero line, if we selloff tommorow.

The bearish shooting star pattern appeared on the NQ at two different timeframes (120-min and the daily charts), which is pretty ominous. For this bearish pattern to confirm, we need to open Friday around the Thursday's closing levels (or even better gap-down) and selloff the rest of the day ending in a red candle. That would confirm that it the rally from ES 1492 was a 2 day wonder and the next downleg has begun. Anyway, i preferred to jump the gun and took a stab at a short here around NQ 1958, since the risk/reward is so good. Not to mention that i closed all my longs at the close. A hourly close above NQ 1968 will stop me out and also keep the bullish structure intact. Call me a bear for today !
We'll see what Friday brings.....
Firstly, the 120-min on NQ and ES is still on a buy, but is in a position to get rejected at the zero line, if we selloff tommorow.

The bearish shooting star pattern appeared on the NQ at two different timeframes (120-min and the daily charts), which is pretty ominous. For this bearish pattern to confirm, we need to open Friday around the Thursday's closing levels (or even better gap-down) and selloff the rest of the day ending in a red candle. That would confirm that it the rally from ES 1492 was a 2 day wonder and the next downleg has begun. Anyway, i preferred to jump the gun and took a stab at a short here around NQ 1958, since the risk/reward is so good. Not to mention that i closed all my longs at the close. A hourly close above NQ 1968 will stop me out and also keep the bullish structure intact. Call me a bear for today !
We'll see what Friday brings.....
Thursday, June 28, 2007
Going into the Fed meeting....
The crescent shaped selloff did mark a bottom of some sort after all. Now the question is "Is the rally sustainable ? ". Before the Fed meeting the technicals have decided what they want to do going into the Fed meeting. Now the real question is "Are those positioned based on these technicals right or wrong ?"
Two charts which are self explanatory.
We are coming out of a very complex bottom on the ES (the complexity which i had not seen in a while). The level of complexity suggests a near vertical rally without any meaningful pullback IMO.

120-min buy signal

Two charts which are self explanatory.
We are coming out of a very complex bottom on the ES (the complexity which i had not seen in a while). The level of complexity suggests a near vertical rally without any meaningful pullback IMO.

120-min buy signal

Wednesday, June 27, 2007
That crescent shaped selloff

That crescent shaped selloff on the NDX is a classic climactic selloff signature. In percentage terms that was no climax, but nevertheless the signature has the characteristics of a climax.
As i noted yesterday, my ES target of 1492 was hit today morning. What is more significant here is that, while ES took out the 6/8 lows, NQ is still holding above it. If i were a bear here and if i see a doji on the hourly candle, without NQ taking out 6/8 lows, then i would be scared - very scared !.
If NQ takes out the 6/8 lows and ES breaks below the 1490-92 support, then a much deeper selloff should be expected. Otherwise, we should make an important low today !
Tuesday, June 26, 2007
Heading into a climax
As i said yesterday, based on the Nasdaq fishhook, we were probably headed into some sort of a selling climax. Seems like they sucked in a lot of bulls yesterday. As i mentioned yesterday, ES 1490-92 was my VST target. We should hit that target tommorow morning. Now how deep the climax is going to be is the multi-million dollar question. If 1490-92 gets taken out, then a deeper selloff somewhere into the ES 1470 area is the next expectation.
Trade safe.
Trade safe.
I am torn...
I am torn between the bullish and bearish view here. I was of the expectation that we are headed to new highs in the ST term. I can no longer envision such a scenario with confidence, given what the internals are saying at this point.
The NSYE summation index is now making a trip towards the zero line. The Nasdaq summation index has formed a fishhook and was rejected from the zero line, which means we are probably headed for some sort of climactic selling. I don't have any downside targets yet. The break of ES 1510 pivot means we retest the ES 1490-92 area in the VST term. Also the 5% and 10% components of the NYSE and Nasdaq MCOs are now below the zero line, confirming the IT downtrend.
The lack of selling pressure in the Nasdaq is quite disturbing here. Given that it's internals are worse than NYSE, it still holding better than the SPX. I don't know whether to intrepret this is bullish or bearish. Internals are clearly bearish, but the price action is bullish.
As i said i am torn between the bull and bear camp. I will try a short trade on NQ today (went short NQ at 1945). Even if we trade above 1958.25 for a tick, i will be out and will switch back to the bull camp. I have been a good fade the last one week. Trade at your own risk.
The NSYE summation index is now making a trip towards the zero line. The Nasdaq summation index has formed a fishhook and was rejected from the zero line, which means we are probably headed for some sort of climactic selling. I don't have any downside targets yet. The break of ES 1510 pivot means we retest the ES 1490-92 area in the VST term. Also the 5% and 10% components of the NYSE and Nasdaq MCOs are now below the zero line, confirming the IT downtrend.
The lack of selling pressure in the Nasdaq is quite disturbing here. Given that it's internals are worse than NYSE, it still holding better than the SPX. I don't know whether to intrepret this is bullish or bearish. Internals are clearly bearish, but the price action is bullish.
As i said i am torn between the bull and bear camp. I will try a short trade on NQ today (went short NQ at 1945). Even if we trade above 1958.25 for a tick, i will be out and will switch back to the bull camp. I have been a good fade the last one week. Trade at your own risk.
Friday, June 22, 2007
Volatile session
We got the bounce yesterday and a pretty strong one at that. Now the big question is "Are we headed to new highs ?". The Nasdaq MCO had a small change day yesterday and the NYSE MCO was close to a small change (not strictly speaking) day. Whatever direction the indexes breaks today, needs to be respected. Today will more likely be a volatile whipsaw session and the range expansion will most likely occur on Monday.
I am betting on new highs for all the major indices. The ES futures dropped to 1527.25 overnight and are bouncing back now. Critical intraday pivots are NQ 1950.50 and ES 1523.25. If we break below that today, bears will have won the battle. Above those pivots, the BULL rules.
I am betting on new highs for all the major indices. The ES futures dropped to 1527.25 overnight and are bouncing back now. Critical intraday pivots are NQ 1950.50 and ES 1523.25. If we break below that today, bears will have won the battle. Above those pivots, the BULL rules.
Thursday, June 21, 2007
I don't quite trust this decline !


Last time i commented, i expected a deeper correction and a trip to zero line on the NYSE MCO. Although i expected this decline, the decline on SPX in particular went faster and deeper than i expected. My 120-min did went into a sell this morning and is in a oversold condition right now.
Take a look at the NDX and SPX charts above.
The daily range on the SPX today was nearly 25 points and the daily range on NDX was a mere 26 points. In percentage terms, SPX had nearly twice the range as NDX. What the heck is going on ?
Look at the MACD on SPX and NDX - SPX had a backkiss, while the NDX still remains on a buy. Again what the heck is going on ?
Also remember the CCI on SPX never reached a overbought condition before turning down and is now right near the zero line support. I don't trust at this point that this is the beginning of the next leg down. This should end up as a short term pullback. The next expectation should be new recovery highs on the SPX.
Monday, June 18, 2007
Corrective action
There's not enough clues at this point to determine whether today's action was distributive or not. But as the correction takes longer time here, there's the risk of 120-min rolling over. So far the 120-min is still on a buy signal and i will post an update if that changes. We had very narrow range movements on the NYSE and Nasdaq MCO, but not close enough to call it small change days. Nevertheless that narrow range and the fact that the MCOs have hooked down means a trip to zero line on the MCO is likely. So my guess is that the correction has a little bit deeper to go before the assault to new highs is made.
Saturday, June 16, 2007
That pesky "W" bottom
I was of the impression the last couple of weeks that SPX was headed to 1450-60, which was a logical IT price target based on the fact that the IT pivot was broken and the NYSE MCO made a new flag. I even posted on traders-talk, the exact day the countertrend rally begun and was expecting a rough target of Sep ES 1536-38 . Once it broke above that level, i was questioning myself.
Now in hindsight, it's clear that SPX put in a "W" bottom. The "W" bottom was tricky to spot, because of the fact that the price did not make lower lows, but ended up as higher lows. We have seen many such lows in this bull market from 2003, which has shown this phenomenon of higher lows. This typically is a product of "Extreme bearishness" at bottom and the system getting clogged so severly with shorts that any countertrend rally ends up in a epic squueze which creates a new leg up. I was one of the first to publish a IT target of 1450-60 when the declione begun. When every newsletter and blogs on the web were abuzz with that number, that was a kiss of death for that target. As i said, i was expecting a restest of the recent lows on SPX till yesterday. But i abandon that view at this point.
One chart says it all. The NYSE MCO made a higher low and price did a retest although that retest ended up as a higher low, which is what threw a curve ball !. The summation has turned up. More important the 5% and 10% components of the MCO are now above the zero line, which keeps the IT uptrend intact again.

As for the VST term, 120-min trend has turned up. Once it turns up, it's very difficult to turn it back down immediately. I say this from my experience and also from examining a large historical data series. So the path of least resistance is now up and will continue so for the next 1-2 weeks at least. The only way the 120-min can be turned down at this point is to have a high velocity selloff of about 25 points on Monday, which i think is very low odds. The market does everyting for a reason. The breakout above Sep ES 1536-38 resistance made it clear that the market was headed much higher. The next logical target is all time highs on the SPX or a double top just below it i.e SPX 1550-55.
Now here's the fun part, which i am sure the Perma bulls will ignore yet again and call for a wave 3 of 3 again. The weekly momentum has turned down, while the daily is up now. Once the daily gets fully overbought here and turns down, it would produce a "Combo Weekly and Daily sell signal". The decline from that signal will be far more powerful and larger than what we witnessed last week.
Bottomline VST, ST, IT bullish. I will post on this blog when the 120-min approaches the sell signal again.
Now in hindsight, it's clear that SPX put in a "W" bottom. The "W" bottom was tricky to spot, because of the fact that the price did not make lower lows, but ended up as higher lows. We have seen many such lows in this bull market from 2003, which has shown this phenomenon of higher lows. This typically is a product of "Extreme bearishness" at bottom and the system getting clogged so severly with shorts that any countertrend rally ends up in a epic squueze which creates a new leg up. I was one of the first to publish a IT target of 1450-60 when the declione begun. When every newsletter and blogs on the web were abuzz with that number, that was a kiss of death for that target. As i said, i was expecting a restest of the recent lows on SPX till yesterday. But i abandon that view at this point.
One chart says it all. The NYSE MCO made a higher low and price did a retest although that retest ended up as a higher low, which is what threw a curve ball !. The summation has turned up. More important the 5% and 10% components of the MCO are now above the zero line, which keeps the IT uptrend intact again.

As for the VST term, 120-min trend has turned up. Once it turns up, it's very difficult to turn it back down immediately. I say this from my experience and also from examining a large historical data series. So the path of least resistance is now up and will continue so for the next 1-2 weeks at least. The only way the 120-min can be turned down at this point is to have a high velocity selloff of about 25 points on Monday, which i think is very low odds. The market does everyting for a reason. The breakout above Sep ES 1536-38 resistance made it clear that the market was headed much higher. The next logical target is all time highs on the SPX or a double top just below it i.e SPX 1550-55.
Now here's the fun part, which i am sure the Perma bulls will ignore yet again and call for a wave 3 of 3 again. The weekly momentum has turned down, while the daily is up now. Once the daily gets fully overbought here and turns down, it would produce a "Combo Weekly and Daily sell signal". The decline from that signal will be far more powerful and larger than what we witnessed last week.
Bottomline VST, ST, IT bullish. I will post on this blog when the 120-min approaches the sell signal again.
Monday, June 11, 2007
VST, ST and IT pivots - all broken in 3 days.
Daily chart

The same signal which gave a daily buy back in March is now on a triple divergence sell. Some rough IT targets for this decline at this point is around SPX 1450-1460. Will refine it, as we move forward. The NYSE MCO has created a new flag, which means the internal low is probably in and the price low in the form of a lower low is pending. If that lower low on price creates a positive divergence with the MCO, then we should expect another leg-up towards new recovery highs. But it's too early to speculate on that. As for a "V" bottom here, i am not a beleiver. In any case, "V" bottoms have 20% odds as opposed to 80% odds for a retest. So i am positioning myself for a retest.
VST chart
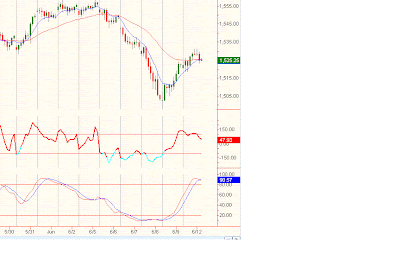
The Full Stochastic on the 60-min chart is fully overbought and is turning down. The EMAs are on the verge of a backkiss. The 60-min CCI diverged and has turned down. So the odds that the bounce from Friday is over, looks very high.

The same signal which gave a daily buy back in March is now on a triple divergence sell. Some rough IT targets for this decline at this point is around SPX 1450-1460. Will refine it, as we move forward. The NYSE MCO has created a new flag, which means the internal low is probably in and the price low in the form of a lower low is pending. If that lower low on price creates a positive divergence with the MCO, then we should expect another leg-up towards new recovery highs. But it's too early to speculate on that. As for a "V" bottom here, i am not a beleiver. In any case, "V" bottoms have 20% odds as opposed to 80% odds for a retest. So i am positioning myself for a retest.
VST chart

The Full Stochastic on the 60-min chart is fully overbought and is turning down. The EMAs are on the verge of a backkiss. The 60-min CCI diverged and has turned down. So the odds that the bounce from Friday is over, looks very high.
Wednesday, June 06, 2007
Inflection point...

If we get a gap-down tommorow again, it could be a VST buy, but it would clearly break that controlling channel on the 120-min charts. So those betting on a irregular flat correction will have to give up. The controlling trendline from the 3/16 lows is already taken out. If you are a blind bull, then that downthrust in the NYSE and Nasdaq MCO may not mean anything.
Let me tell you something. If the uptrend is alive, the market will start going up from the get-go tommorow without breaking below that cahnnel, as though no technical damage has happened and will never look back. A close on 120-min basis below that channel tommorow will be a high odds signal that we are looking at more than a VST correction with much more downside to come. The summation on both the NYSE and Nasdaq has turned down. The breakdown in the MCOs do not look like a hesitation pattern, but looks something decisive.
To me any daily close on the ES below 1512.50 would mean that the back of the bull is broken and a multi-week correction is underway. What shape the correction would take is anybody's guess at this point. Clearly we are at a inflection point.
Analysis only provides the framework for my trades. Those who are interested in my trades , i post them on traders-talk.com.
Tuesday, May 15, 2007
Before i leave for the vacation....

I am going on vacation and will be back on June 1. Before i leave, i thought i would post a chart of the daily charts rolling over. The picture says it all !
Thursday, May 10, 2007
Daily momentum sell at the close
My system generated a momentum sell on the daily charts today.
Last time i commented, i had a VST bias into SPX cash 1493, which got tagged today. If the uptrend on the hourly charts were intact, then we would have seen a powerful rally out of that pivot. The fact that the pivot did not hold and the daily momentum kicked into a "Sell", means, this is more than a VST correction. So i would not be a buyer here. Not yet !
Now the million dollar question is whether this is a ST correction or an IT correction. The ST pivot on the SPX cash comes around 1474-1478 area, which should be the focal point for the daily trend traders to go long. Again, we'll evaluate if and when we get there. If the 1474-78 area cracks on a daily closing basis, then it would blossom into a full blown IT sell, which would target the SPX 1420-30 area. Again, i don't pretend to have a crystal ball that far. So taking one baby step at a time.....
Also of interest is that the Nasdaq MCO broke below the late April lows. Both the 5% and the 10% trends on the Nasdaq MCO are now below zero, which is also suggesting that this is more than a VST drop. The NYSE MCO is barely holding above the late april lows and if it follows the Nasdaq, the next day or two should see the NYSE MCO taking out those lows.
Last time i commented, i had a VST bias into SPX cash 1493, which got tagged today. If the uptrend on the hourly charts were intact, then we would have seen a powerful rally out of that pivot. The fact that the pivot did not hold and the daily momentum kicked into a "Sell", means, this is more than a VST correction. So i would not be a buyer here. Not yet !
Now the million dollar question is whether this is a ST correction or an IT correction. The ST pivot on the SPX cash comes around 1474-1478 area, which should be the focal point for the daily trend traders to go long. Again, we'll evaluate if and when we get there. If the 1474-78 area cracks on a daily closing basis, then it would blossom into a full blown IT sell, which would target the SPX 1420-30 area. Again, i don't pretend to have a crystal ball that far. So taking one baby step at a time.....
Also of interest is that the Nasdaq MCO broke below the late April lows. Both the 5% and the 10% trends on the Nasdaq MCO are now below zero, which is also suggesting that this is more than a VST drop. The NYSE MCO is barely holding above the late april lows and if it follows the Nasdaq, the next day or two should see the NYSE MCO taking out those lows.
Monday, May 07, 2007
No top of importance in sight
Sorry i coudn't update my blog since April 23, since i had some personal preoccupations.
My April 23 forecast for a drop to 1452 was invalidated by the market action. I was wrong !. Every day the market throws new information. Only a stubborn ego-maniac analyst can afford to ignore such information. Right now the market says that we have not seen any top of importance. So as a trend trader, the next area of importance seems to SPX 1493, which should be the area where a hourly swing/trend trader need to focus on going long. For VST traders, today has a downward bias for a drop into SPX 1493.
My April 23 forecast for a drop to 1452 was invalidated by the market action. I was wrong !. Every day the market throws new information. Only a stubborn ego-maniac analyst can afford to ignore such information. Right now the market says that we have not seen any top of importance. So as a trend trader, the next area of importance seems to SPX 1493, which should be the area where a hourly swing/trend trader need to focus on going long. For VST traders, today has a downward bias for a drop into SPX 1493.
Monday, April 23, 2007
ST Top ?
Based on the pattern, momentum on daily charts and dynamic supports on daily, i have some targets which should be acheived within a week.
ES 1452-1454, NQ 1800-1805.
Violation of Friday's highs on a hourly closing basis will invalidate these projections. I remain short NQ from 1854 with a stop above today's highs. Based on my 30-min charts, it appears that we will start with a gap-down on Monday. FWIW.
Friday was a Euphoric close with a closing tick of +1250. Those who were buying the close went home with the expectation of a probable gap-up. Talk about "To da moon anxiety" !. Top tick closes, especially on OPEX fridays is a bearish sign. Monday could end up as a big red candle day !
ES 1452-1454, NQ 1800-1805.
Violation of Friday's highs on a hourly closing basis will invalidate these projections. I remain short NQ from 1854 with a stop above today's highs. Based on my 30-min charts, it appears that we will start with a gap-down on Monday. FWIW.
Friday was a Euphoric close with a closing tick of +1250. Those who were buying the close went home with the expectation of a probable gap-up. Talk about "To da moon anxiety" !. Top tick closes, especially on OPEX fridays is a bearish sign. Monday could end up as a big red candle day !
Wednesday, April 11, 2007
8 hours of bearish excitement
May last another couple of hours tommorow morning 
As i commented in my blog last, the market looked tired as we approached 1448 and a reaction looked inevitable. My downside targets for the move was SPX 1428-30 (ES 1438-40). I will refine it to SPX 1430-32, which should be tagged tommorow morning.
ES 1440-42 is a key area, which should provide support. If this area is breached, then lower targets like ES 1428-30 will come into play. Need more clues in the form of price action tommorow to determine if that's the case.
In any case, the next move of consequence should be a move to a new recovery highs on the SPX.
As i commented in my blog last, the market looked tired as we approached 1448 and a reaction looked inevitable. My downside targets for the move was SPX 1428-30 (ES 1438-40). I will refine it to SPX 1430-32, which should be tagged tommorow morning.
ES 1440-42 is a key area, which should provide support. If this area is breached, then lower targets like ES 1428-30 will come into play. Need more clues in the form of price action tommorow to determine if that's the case.
In any case, the next move of consequence should be a move to a new recovery highs on the SPX.
Monday, April 09, 2007
VST top
If i wanted fame, i would have made a dramatic call that the next 100 points on SPX will be down or this top will not be seen in my lifetime. But i am a trader and i want money :-)
I do not see anything that suggests a major top is in place. But that does not preclude any non-linear drops, which i can't predict with any TA methods. Last time i made a projection was when SPX was trading near 1416. I had a preliminary projection to around SPX 1455-1460. I have to refine those targets now to yesterday's high at 1448.10. Good enough for government work.
The smart money OEX folks were loading up on puts with OEX P/C ratio hitting intraday highs of 3.81. The not-so-smart equity folks were loading up on calls like there's no tommorow. So i am expecting sometime of reaction to the downside over the next couple of days.
At a minimum we have a swing top in place on the hourly charts based on my work. The next move should take us to ES 1438-40 (SPX 1428-30). After this breif reaction, the uptrend should continue.....
I do not see anything that suggests a major top is in place. But that does not preclude any non-linear drops, which i can't predict with any TA methods. Last time i made a projection was when SPX was trading near 1416. I had a preliminary projection to around SPX 1455-1460. I have to refine those targets now to yesterday's high at 1448.10. Good enough for government work.
The smart money OEX folks were loading up on puts with OEX P/C ratio hitting intraday highs of 3.81. The not-so-smart equity folks were loading up on calls like there's no tommorow. So i am expecting sometime of reaction to the downside over the next couple of days.
At a minimum we have a swing top in place on the hourly charts based on my work. The next move should take us to ES 1438-40 (SPX 1428-30). After this breif reaction, the uptrend should continue.....
Friday, April 06, 2007
OIH - rolling over on all timeframes !


On the OIH, weekly momentum is overbought and rolling over. There's major horizontal trendline resistance and also resistance from the broken trendline. In the second charts the daily momentum is showing severe divergence and the daily Stoch is overbought and trying to rollover. On the 120-min, again, it's overbought and trying to rollover. One can only conclude that we are at a IT turning point on the OIH. I am expecting OIH to severly selloff starting Monday, which should be a good indication that the trend has turned down. Otherwise we might fool around the resistance area for some more time. Either way, a major correction is not that far away.
Subscribe to:
Posts (Atom)


