The VST 1-2 days scary decline that i posted yesterday is almost done or very close to be over. A reverse divergence setup is close to getting confirmed on the 60-min charts. Will start looking for signs of bottom and the long side tommorow. Today's decline qualifies as a wave C of the running correction.
If tommorow closes in red, the scenario could change completely, which would kick the daily momentum to a sell and a retest of the 1/3/06 lows will be in order. So i will be watching tommorows action closely to get more clues.
Both Euro and YM had great day trading opportunities today, with virtually no exit for shorts
Thursday, January 12, 2006


Wednesday, January 11, 2006
Bumping against a Brickwall
There's a cluster of resistances between 1290-1300, which is unlikely to be taken out in the first attempt. So a reaction is very likely here. The markets have been moving up in a corrective advance the last few days. When the market is moving up in a corrective fashion and making new highs, it means that there's so much bullish pressure that the correction is happening to the upside instead of to the downside, which is called a running correction in e-wave terms. The strong breadth behind the move also confirms the running correction thesis. Based on the strong internals behind the advance, this leg-up is likely to continue for weeks instead of days. If SPX 1300 gets taken out, then SPX 1335 will come in a flash.
I am expecting a 1-2 day scary correction here, which will weaken the bulls resolve and bring out some mega bear warnings from the usual suspects. Then a move higher to fade both the weak bulls and aggresive bears. Same Old .. Same Old !
Saturday, January 07, 2006
Why is everyone so beared up ?
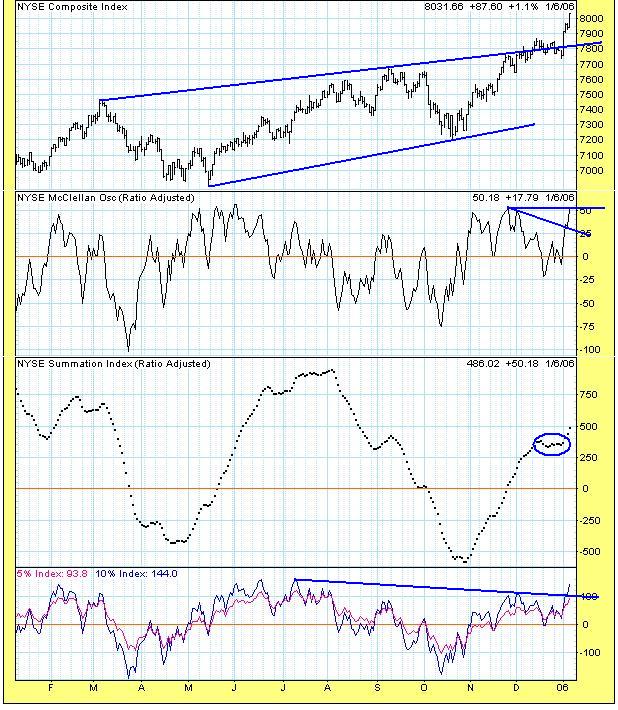
We are having breakouts on most indices with solid internals and yet there's so much disbelief. I think this whole disbelief in the rally stems out from the fact that the majority are now looking for the 4-year cycle bottom in 2006, which is a very widely publicized event. The wide acceptance and positioning for this event makes it a slim probability occurence now. Look what happened to the much publicized 80-week cycle bottom that was furiously discussed last week.
Instead of asking why the market is rallying in face of the current fundamentals or why it shoudn't be rallying as theorized by the market letter writers, one has to look at what the internals are suggesting.
Take a look at the above chart of NYSE. Price has clearly broken out of the wedge that so many have been discussing. This whole wedge theory has been clearly invalidated at least on the NYSE. I noted a month back on this blog why the wedge theory is bogus, given the interrelationship between the the different wave components in the wedge, which doesn't confirm to the Ending diagonal requirements.
The 5% and the 10% components of the MCO have already taken out the Nov 2005 highs. The NYSE MCO is close to taking out the Nov 2005 highs. If this happens then the bears looking for an intermediate or a long term top will be dissapointed here. The summation index has formed a ledge and is now moving higher, which is again a very bullish sign. I don't see any reasons to get bearish in the face of such solid internals. In fact such bearishness here can only lead to one heck of a rally. The system is awash with unprecedented liquidity and don't fight it.
The Hourly/Daily/Weekly/Monthly trends are all up. In the VST we are very overextended. So, we may get a small pullback starting Monday, but every pullback is a buying opportunity at this stage until the current technicals/trend change.
Thursday, January 05, 2006
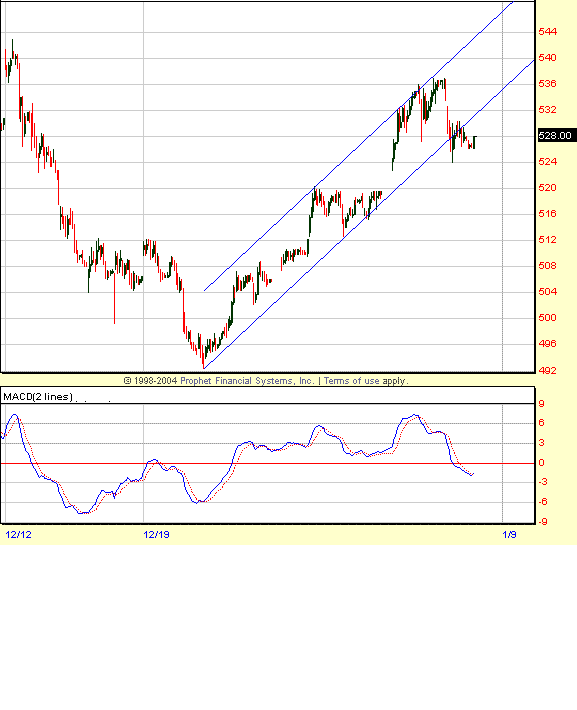
Bearish setup on GOLD
Two charts says it all !
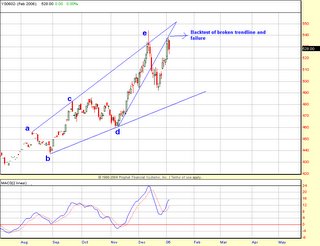
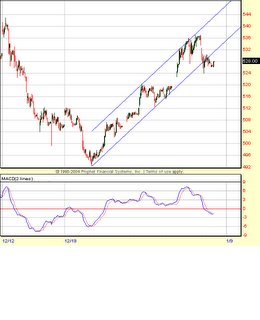
As far as SPX is concerned it's a tough call. One has to play by the ear. It appears like a rectangular consolidation on the hourly charts and ready to breakout. But the hourly is ovebought and some retracement is due, before the next leg up. Also a 80-week cycle low is due around Jan 13.

As far as SPX is concerned it's a tough call. One has to play by the ear. It appears like a rectangular consolidation on the hourly charts and ready to breakout. But the hourly is ovebought and some retracement is due, before the next leg up. Also a 80-week cycle low is due around Jan 13.
Wednesday, January 04, 2006
Bear market rally theme continues
Before i left for vacation, i said that there was some more downside work left and it appears that the downside work is over.
The rally theme of the last 3 years continues. Every reaction off of the top is taken as the next mega bear decline signal. The system gets clogged with shorts and the programs kick-in and squeeze the juice out of the bears. It was surprising as to how much bearishness was seen on the message boards over the last couple of weeks for a mere 30 point decline on the SPX. Bears arguments are getting more and more fundamental rather than technical, justifying for a big decline to come. Two arguments at this stage are the expected 4-year cyle bottom in late 2006 or early 2007 and the latest being the Yield curve inversion, a precursor to a recession.
However, the technicals tell a different story. The daily MACD is comfortably above the zero line impyling that the bullish uptrend is still intact for now. We may have seen a zero line reject on the MACD yesterday which means that the next leg up might have begun. It's a tad early to say that, but based on the size of the move and the technicals, i think the odds are that the next leg up is underway.
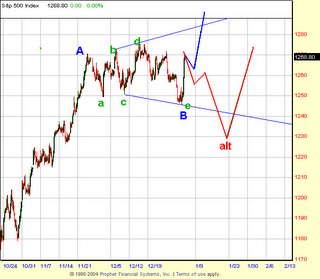
From a e-wave perspective, i think yesterday we finished the wave B of an expanding triangle and wave C is now underway. Until more confirmation comes, i will have to give some weight to the alternate count as well. My alternate count is that yesterday was a news induced rally (a wave X) with another A-B-C downleg yet to come. If my alternate count is true, we should find support around the SPX 1230 levels. At this stage, i will wait for a retracement and see how it plays out, before commiting to either count.
For now, the hourly trend and momentum is up and will look for day trades in that direction. The hourly is getting overbought here, so some sort of retracement/consolidation of yesterday's move is to be expected here.
The rally theme of the last 3 years continues. Every reaction off of the top is taken as the next mega bear decline signal. The system gets clogged with shorts and the programs kick-in and squeeze the juice out of the bears. It was surprising as to how much bearishness was seen on the message boards over the last couple of weeks for a mere 30 point decline on the SPX. Bears arguments are getting more and more fundamental rather than technical, justifying for a big decline to come. Two arguments at this stage are the expected 4-year cyle bottom in late 2006 or early 2007 and the latest being the Yield curve inversion, a precursor to a recession.
However, the technicals tell a different story. The daily MACD is comfortably above the zero line impyling that the bullish uptrend is still intact for now. We may have seen a zero line reject on the MACD yesterday which means that the next leg up might have begun. It's a tad early to say that, but based on the size of the move and the technicals, i think the odds are that the next leg up is underway.

From a e-wave perspective, i think yesterday we finished the wave B of an expanding triangle and wave C is now underway. Until more confirmation comes, i will have to give some weight to the alternate count as well. My alternate count is that yesterday was a news induced rally (a wave X) with another A-B-C downleg yet to come. If my alternate count is true, we should find support around the SPX 1230 levels. At this stage, i will wait for a retracement and see how it plays out, before commiting to either count.
For now, the hourly trend and momentum is up and will look for day trades in that direction. The hourly is getting overbought here, so some sort of retracement/consolidation of yesterday's move is to be expected here.
Saturday, December 24, 2005
Wednesday, December 21, 2005
Bearish Backkiss on the hourly charts
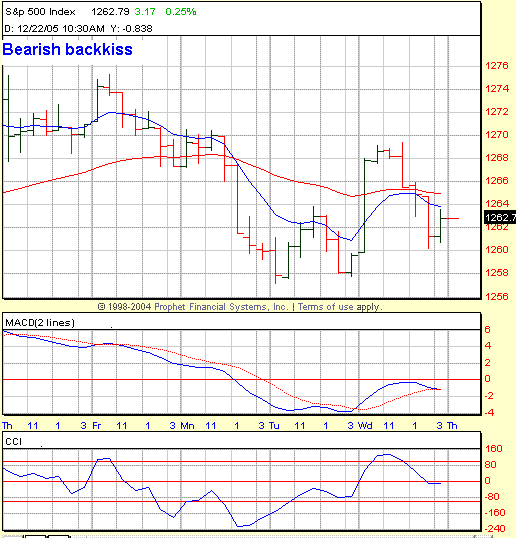
As i mentioned on Monday, the 120-min on NDX was in a deeply oversold condition and a bounce was overdue. Today we bounced hard but reversed nastily into the close, creating a bearish backkiss on the hourly EMAs and a zero line backkiss on the MACD. This suggests that there's more work to be done on the downside. Today's high should remain intact for the bearish case here. If today's highs are taken out, it would confirm a reverse divergence setup on the daily charts, which would lead to new recovery highs on all the indices. I doubt that's the case given the rally failure today, but it helps to be open minded when it comes to trading.
Overall we remain in a overlapping choppy market. So these days i tend to trade the 15-min and hourly charts to maximize gains. Trading is not really a sophisticated game that requires one to use Fractal geometry, Parabolic curves, Gann angles, Neural networks Fourier analysis, Spiral calendars et al to make money. They all look sexy on the charts, but not add much to the trading bottom line. Throw in a bunch of EMAs to follow the trend and moementum indicators to signal the reversals and you are all set.
Good luck trading and happy holidays.
Monday, December 19, 2005
Hourly sell on all the indices
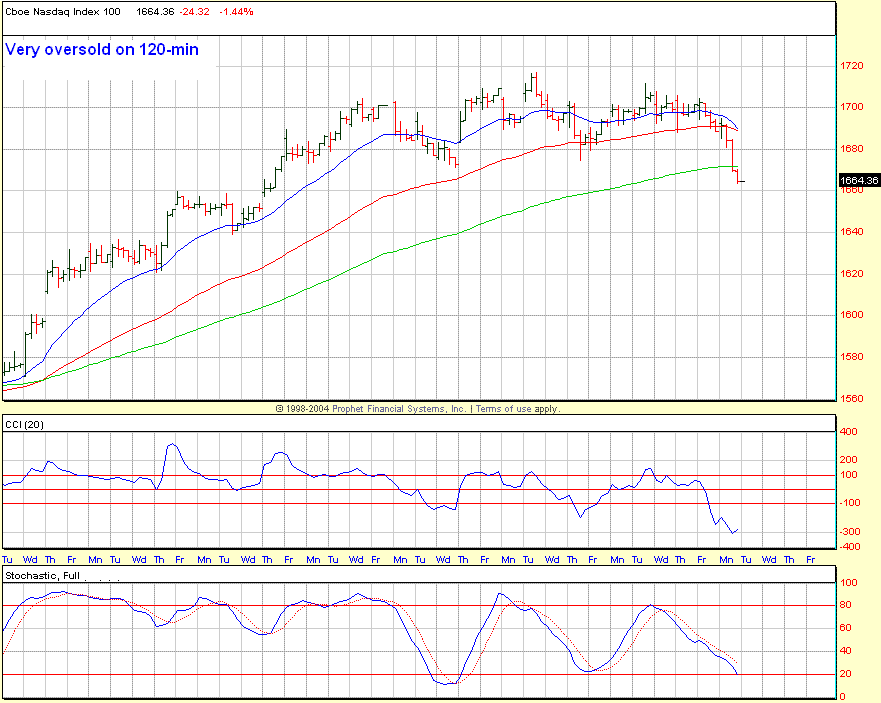
The hourly went on a sell on all the indices today - DOW, SPX, NDX and RUT on both momentum and trend basis. There were no-brainer setups to go short today, if one followed the 15-min charts. Here we are in a seasonally bullish period and technically awful looking markets.
The e-wave count on NDX got invalidated as soon as we broke below the lower trendline of the triangle. That's why it pays to watch the momentum indicators and not get married to the wavecount. The 120-min on NDX tells the story for today, which is extremely oversold. A -300 reading on the CCI(20) and it has hooked back above it. The Full Stoch is almost oversold.
The daily on the NDX suggests two possibilities, either a slingshot reversal from here or a trip to 1640-1645 where it meets the 60 EMA, just to get everyone beared up and another attempt at nominal highs. If we were to make any nominal new highs on the indices here, the upmove have to be swift i.e a slingshot kind of move. Instead if we churn sideways after the decline, the bear has started....
The daily CCI on the SPX is right near the zero line, where a reversal can start anytime. I am not too beared up on DOW and SPX at this point as far as swing trading is concerned. Both are right at the support zones. If we fail here, then 1240 (SPX) and 10680 (DOW) would be next major support zones.
Saturday, December 17, 2005
NDX - E-wave count
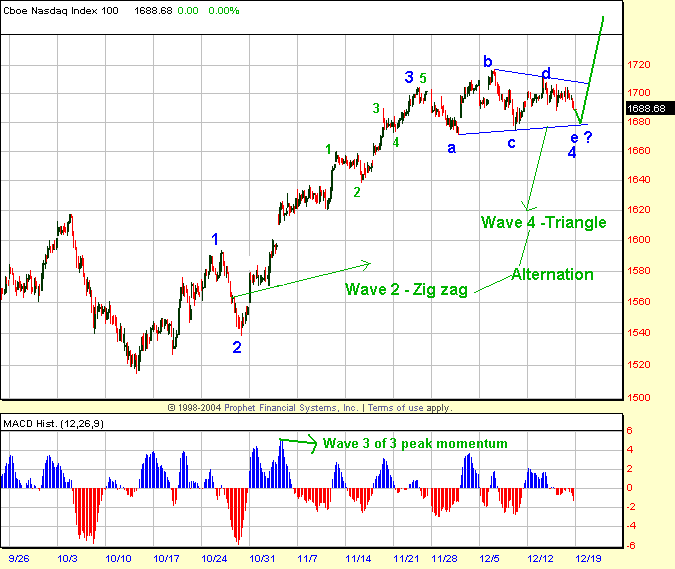
NDX sports a clear e-wave count, following all elliot rules, chanelling and alternation. If the lower trendline of the triangle gets taken out, then this count is wrong.
Friday, December 16, 2005
SPX - Weekly, Daily, Hourly
My anlaysis is based on Trend and Momentum. Best signals come when both are in Sync. Blind trend following is dangerous. Look what happened to Gold last week. The upward trend was intact, but the momentum clearly gave a sell signal. Those who ignored the momentum got clobbered.
There's been a lot of top picking and top calling in the stock market. Let's examine what the markets are saying.
SPX Weekly - Momentum buy, Trend Buy
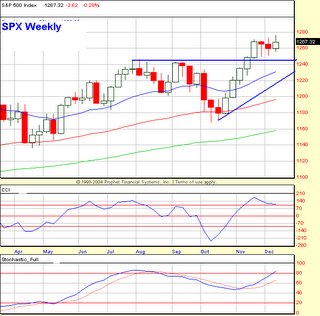
The weekly picture is very clear. We have a weekly breakout and the market is consolidating above the breakout line. Look at the CCI, which is yet to show divergences with the price. This most likely means the top is at least another 1-2 weeks away. The weekly Full Stoch is also rising and no crossover there.
SPX Daily - Momentum Buy, Trend Buy
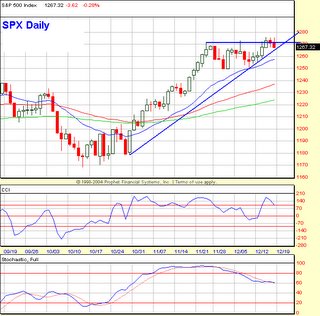
The daily trend is up as evidenced by the EMAs and the trendline itself. The daily chart is a bit of concern in the ST term. The price is perched on the trendline, break of which could lead to the retest of recent lows. So far we have had 4 failed breakout attempts. Again we need momentum divergences here, which has not yet been established.
SPX Hourly - Momentum Sell, Trend Buy
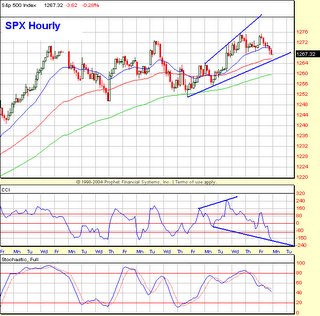
Hourly chart is suggesting some sort of expanding formation here. Look at how the CCI is going from extreme to extreme, which is typical of an expanding environment. In a contracting environment, the CCI keeps oscillating around the zero line. Hourly is on a momentum sell, but is still a buy on a trend basis. If we take out the trendline from 12/8, we could see some serious selling, causing the EMAs to slant downwards and create crossovers, issuing a trend sell. Until the Trend and momentum are both on sell, it's a weak sell and one tends to accumulate a lot of false signals in the long term by taking those weak signals.
So for VST, i will go long on Monday, if we get a hourly momentum buy. If the hourly trend turns down, i will go short.
There's been a lot of top picking and top calling in the stock market. Let's examine what the markets are saying.
SPX Weekly - Momentum buy, Trend Buy

The weekly picture is very clear. We have a weekly breakout and the market is consolidating above the breakout line. Look at the CCI, which is yet to show divergences with the price. This most likely means the top is at least another 1-2 weeks away. The weekly Full Stoch is also rising and no crossover there.
SPX Daily - Momentum Buy, Trend Buy
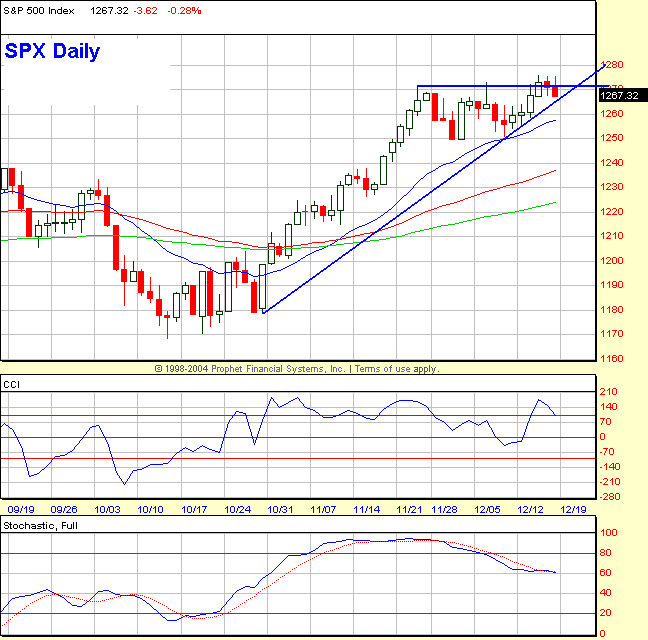
The daily trend is up as evidenced by the EMAs and the trendline itself. The daily chart is a bit of concern in the ST term. The price is perched on the trendline, break of which could lead to the retest of recent lows. So far we have had 4 failed breakout attempts. Again we need momentum divergences here, which has not yet been established.
SPX Hourly - Momentum Sell, Trend Buy
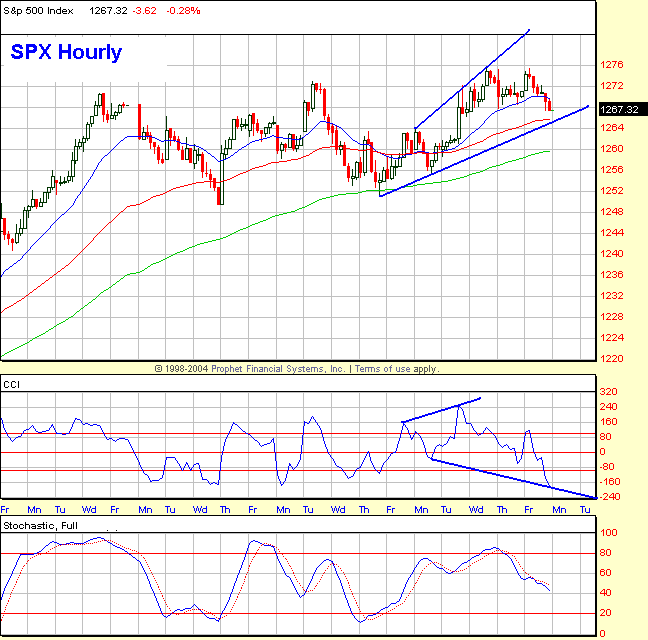
Hourly chart is suggesting some sort of expanding formation here. Look at how the CCI is going from extreme to extreme, which is typical of an expanding environment. In a contracting environment, the CCI keeps oscillating around the zero line. Hourly is on a momentum sell, but is still a buy on a trend basis. If we take out the trendline from 12/8, we could see some serious selling, causing the EMAs to slant downwards and create crossovers, issuing a trend sell. Until the Trend and momentum are both on sell, it's a weak sell and one tends to accumulate a lot of false signals in the long term by taking those weak signals.
So for VST, i will go long on Monday, if we get a hourly momentum buy. If the hourly trend turns down, i will go short.
Thursday, December 15, 2005
12/15 - Intraday observation
10:00 AM PST
The intraday pattern on DOW seems eerily similar to 10/3. High at the open and a nasty selloff and a sideways flag. We'll see if we get a big 2:00 PM EST selloff. Intraday pattern looks very similar, but the daily configuration is very different though. Just an observation.
I am looking to go short here, if i get a sell signal on the 30-min.
1:30 PM PST
Except for the initial spike and the thrust down (one buy and another sell program neutralizing each other), nothing else transpired today. I don't expect much to happen tommorow either, being a OPEX day, other than some crazy intra-day spikes. The hourly and daily trend remains intact so far and the bias continues to be to the upside.
The intraday pattern on DOW seems eerily similar to 10/3. High at the open and a nasty selloff and a sideways flag. We'll see if we get a big 2:00 PM EST selloff. Intraday pattern looks very similar, but the daily configuration is very different though. Just an observation.
I am looking to go short here, if i get a sell signal on the 30-min.
1:30 PM PST
Except for the initial spike and the thrust down (one buy and another sell program neutralizing each other), nothing else transpired today. I don't expect much to happen tommorow either, being a OPEX day, other than some crazy intra-day spikes. The hourly and daily trend remains intact so far and the bias continues to be to the upside.
Wednesday, December 14, 2005
SPX - Patience bears
The market played almost exactly to my script yesterday. We moved up (did not gap up), came back retested 1276 on ES and shot higher. The daily and the hourly trend continues to be up. So the winning trades will be on the long side, until that trend reverses.
I admit this rally is long in the tooth and can reverse nastily anytime. So swing trading on the longside is a risky proposition. One can make 20 points on SPX and give it all back in a day. Or worse enter at the top and lose big money. Best strategy is to wait for good 15-min or 30-min setups and daytrade the market with tight stops in the direction of the hourly trend. For instance today on YM, at 10920 there was a good 15-min momentum buy setup, the 15-min EMAs were pointed up and it required a 13 point stop. Took it and traded for a 50 point profit (almost 1:4 risk/reward).
There were inter-market divergences today between NDX and SPX/DOW - warning signs that a top is getting close. As for the targets, i still beleive SPX 1285-1290 is in the cards.
I cannot provide the signals from my system for entries and exits, as that would constitute buy/sell advice. But i will try to post the Daily and hourly trend/momentum and trend turns as i get signals from my system. My goal for this blog is to continually remind myself of the underlying trend and at the same time share it with others. Comments are always appreciated and if you have any ideas or analysis you would like to share with me, e-mail me at nav-ta@hotmail.com.
I admit this rally is long in the tooth and can reverse nastily anytime. So swing trading on the longside is a risky proposition. One can make 20 points on SPX and give it all back in a day. Or worse enter at the top and lose big money. Best strategy is to wait for good 15-min or 30-min setups and daytrade the market with tight stops in the direction of the hourly trend. For instance today on YM, at 10920 there was a good 15-min momentum buy setup, the 15-min EMAs were pointed up and it required a 13 point stop. Took it and traded for a 50 point profit (almost 1:4 risk/reward).
There were inter-market divergences today between NDX and SPX/DOW - warning signs that a top is getting close. As for the targets, i still beleive SPX 1285-1290 is in the cards.
I cannot provide the signals from my system for entries and exits, as that would constitute buy/sell advice. But i will try to post the Daily and hourly trend/momentum and trend turns as i get signals from my system. My goal for this blog is to continually remind myself of the underlying trend and at the same time share it with others. Comments are always appreciated and if you have any ideas or analysis you would like to share with me, e-mail me at nav-ta@hotmail.com.
Tuesday, December 13, 2005
SPX - Next leg up underway...
As i said yesterday, it was a tinderbox situation. The powder just had to be lit. When the hourly EMAs are as flat as my abs, the risk/reward becomes even on both the sides. That's why i hate those situations. I would rather take a trade when the EMAs are moving up or down.Having said that, i will be looking for daytrades in the direction of the hourly trend which is up for now, when i get a good setup.
This move looks like a headfake, but that's what the final leg up is supposed to look like. I think the market will rally with poor breadth and volume with the shorts fighting all the way up. I will better be a bit late and let the downtrend establish itself again before jumping on the short side. Me thinks SPX 1285-1290 is in the cards. If the hourly turns down here anytime, i will be quick as lightining to change my bias and join the shorts. Until then, long is my song...
Look at how nicely they created the zero line reversal on the CCI(14).
My preferred scenario for tommorow is probably a gap up and then come down retest the 1274-1275 on ES (1264-1265 on SPX) and then take off to the upside. If SPX 1261 is broken kiss a goodbye to the uptrend.
This move looks like a headfake, but that's what the final leg up is supposed to look like. I think the market will rally with poor breadth and volume with the shorts fighting all the way up. I will better be a bit late and let the downtrend establish itself again before jumping on the short side. Me thinks SPX 1285-1290 is in the cards. If the hourly turns down here anytime, i will be quick as lightining to change my bias and join the shorts. Until then, long is my song...
Look at how nicely they created the zero line reversal on the CCI(14).
My preferred scenario for tommorow is probably a gap up and then come down retest the 1274-1275 on ES (1264-1265 on SPX) and then take off to the upside. If SPX 1261 is broken kiss a goodbye to the uptrend.
Monday, December 12, 2005
SPX - Tinderbox situation
Tommorow is the FOMC day again, which means what Greenie says or not says will cause a big move. The Daily and the Hourly continues to be on a sell on the SPX, more so on the DOW. The daily CCI(14) is still hovering below zero, but barely so.
It's a tinderbox situation. The hourly EMAs are flat on the SPX, which means it doesn't take much to create a hourly buy or sell here. Since the daily CCI is barely below zero, it doesn't take much to create a zero line reversal and a daily buy here. So keep your powder dry and follow the big money, after they push the buttons post Fed announcement. I am completely flat here.
It's a tinderbox situation. The hourly EMAs are flat on the SPX, which means it doesn't take much to create a hourly buy or sell here. Since the daily CCI is barely below zero, it doesn't take much to create a zero line reversal and a daily buy here. So keep your powder dry and follow the big money, after they push the buttons post Fed announcement. I am completely flat here.
Sunday, December 11, 2005
SPX 12/11/05 - Possible bearish diamond formation
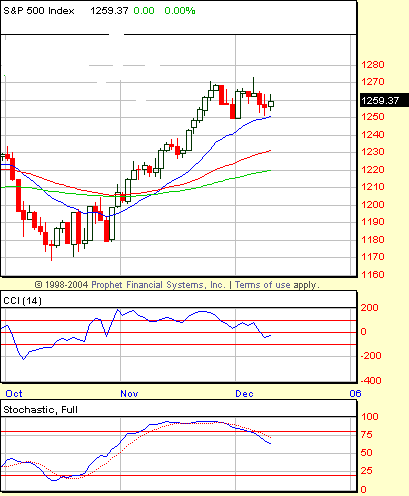

As mentioned on Dec 07, we got our gap filled on ES at 1252.50. Now do we race up to new highs from here ? Purely from a e-wave perspective we never got a wave C (clean 5 waves). So the downside appears incomplete at this point.
SPX appears to be squeezed in a possible bearish diamond formation. SPX 1250 is the key now. Is 1250 gets taken out, the next minor support is in the 1241 area and major support around the 1230 area. My expectation is for a test of the key 1230 area, get everyone sufficiently beared up and then take off to the upside for the year-end rally.
From a momentum perspective, the CCI(14) has broken below the zero line. The Full Stoch has rolled over, suggesting there's more work on the downside. But given the size of the decline relative to the thrust out of these oscillators suggests that this is not the beginning of the next major leg down, instead a correction in the uptrend.
For now the daily and the hourly trend are down. Go with it. Shorting the bounces on the intraday charts would be the theme for the next few days, until the hourly turns up.
Wednesday, December 07, 2005
High level consolidation over ?
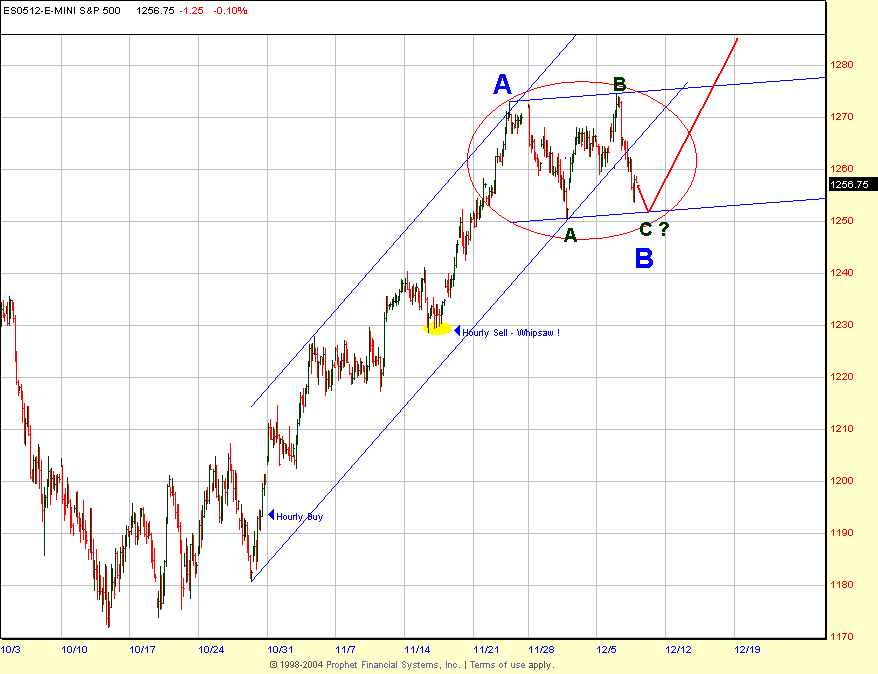
Based on how the e-wave pattern is emerging, it's looking more like a high level consolidation rather than a topping process here. Here's some interesting Fibo relationships
The first leg wave A on ES (1272.50 - 1250.50) = 22 points.
Irregular Wave B (1250.50 - 1274.50) = 24 points.
Wave C (1274.50 - ??) = 22 points
?? = 1252.50, which would make wave A = wave C
The whole structure here looks more like a irregular flat which should end tommorow at 1252.50, which will also fill the last thursday's gap-up. Then a run to new highs around SPX 1285-90.
If 1250.5 gets taken out, then it could turn out be an expanded flat correction with a target of 1245. If we break below 1242.5 on ES, then something more bearish is in works and we might have seen an important intermediate top.
Anyway bottom piciking is always dangerous. So it's better to wait for a 30-min or a hourly buy signal and get aboard the train. If one were to bottom pick here, the safest instrument would be options and definetly not futures.
SPX - Right on the channel support
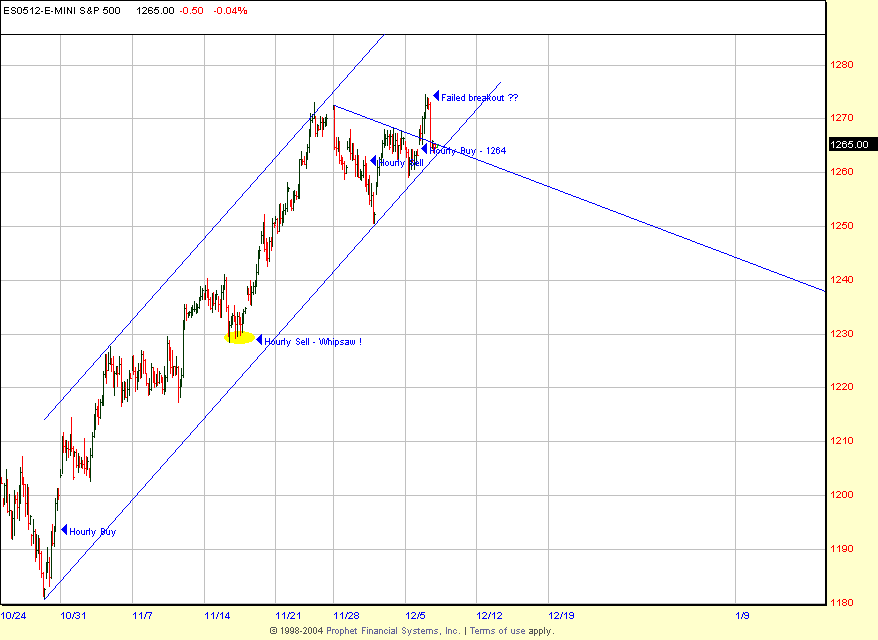
As i said yesterday, if ES takes out 1268, then we should make nominal new highs. We did make nominal new highs which ended in a sharp reversal. The inter-market divergences were telling a story for those who wanted to listen. NDX and SPX made nominal new highs while, the DOW coudn't. SPX has still not issued a hourly sell, although it's on a 30-min sell. If 1263 (channel support) gets taken out on the ES, there could be some serious selling. For now 1263 is the key. If it's taken out, my strategy would be to short the bounces.
Tuesday, December 06, 2005
SPX Daily - 12/6/05
The message boards on the web are humming with the talk of DOW 12000, 14000 etc. There's this elusive last leg up left and it's year ending with 5. There are well intentioned advise from bulls, as to why it's not worth being short here even for a very short term trade. This kind of sentiment is what intermediate tops are made of. While a last furious leg of rally cannot be ruled out, we have to work with what the hourly and daily momentum are saying at this point.
The daily is close to a sell, but not confirmed. The hourly was on a sell on all the indices - NDX, DOW and SPX at yesterday's close. With the gap-up work, they have managed to move the SPX hourly to a buy, but the DOW still remains on a sell. Still short from 1267 on the Dec ES. If we take out 1268.25 on the Dec ES, i will stand aside. If we take out 1268.25, then we could see a double top at 1273 or slightly higher highs.
The daily is close to a sell, but not confirmed. The hourly was on a sell on all the indices - NDX, DOW and SPX at yesterday's close. With the gap-up work, they have managed to move the SPX hourly to a buy, but the DOW still remains on a sell. Still short from 1267 on the Dec ES. If we take out 1268.25 on the Dec ES, i will stand aside. If we take out 1268.25, then we could see a double top at 1273 or slightly higher highs.
Thursday, December 01, 2005
Kissback of broken trendline or a breakout ?
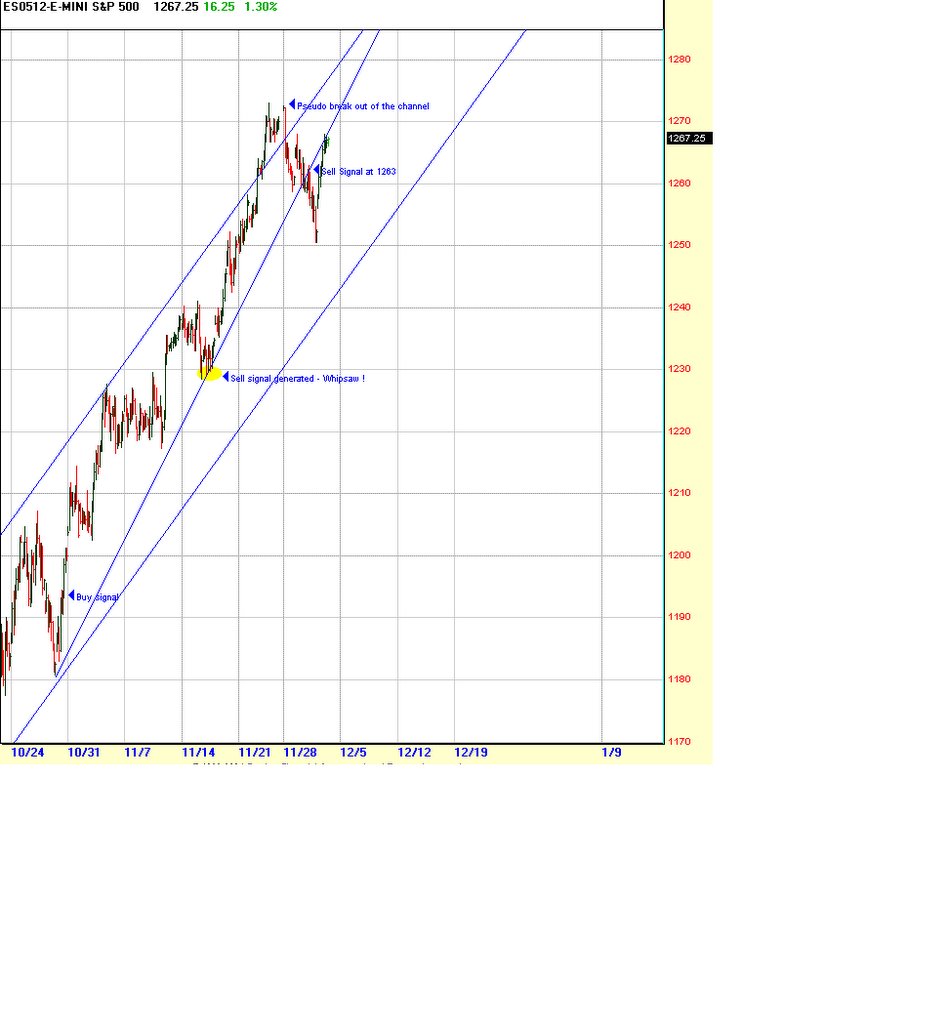
Yesterday's hourly sell on SPX was good for 13 points, if one covered at yesterday's close. If one held it till today morning's big gap-up, it would have been a breakeven to slighly profitable trade, depending on where one exited. Had they not created that monster gap up, it would have taken quite a while for them to turn the hourly up. The shorts would have sensed the hourlies turning up and start covering thier positions at lower levels, without leaving much fuel for a breakout. On the other hand a huge gap up ensures that the shorts will start covering at higher levels rather than lower levels, causing a breakout.
This is smelling like a false breakout for now. So far the price action has kissed the broken trendline from below. A failure here could mean a retest of yesterday's lows. I would call this another good shorting opportunity with a hard stop around 1273.25. If 1273 is taken out, i would stay away from the short side until another good setup comes up.
Wednesday, November 30, 2005
SPX - Hourly Sell signal today morning

Going forward, i will share the signals from my Momentum/Trend trading system. The signals from my system never comes at the exact tops or bottoms for a simple reason, because tops or bottoms can never be identified in real-time and are known only in hindsight. When a market is at or near the top, for instance, the moving averages are pointed upward and the momentum is up (although the the rate of change of momentum is slowing down i.e a divergence). As long as the momentum breaks and the moving averages turn around, the market is essentially in a uptrend. If someone catches a top, it's just luck. There's a price to be paid for top and bottom picking. Tops and bottoms can be picked with multiple probes with tight stops and stop outs. The multiple stopout losses can add up and at the same time, one would also lose the opportunity of participating in the uptrend. My hourly trading system is designed to give a sell or buy signals about 5-10 points from the top or bottom and the signals could be valid for anywhere between 1-5 days and sometimes even more. I will try to post the chart with buy/sell signals from my system everyday on ES (E-mini S&P 500) and Gold, with stop loss levels. Today morning i got a sell on ES at 1263 and so far remains on a sell. I will not try to preempt my system by attempting to closeout my positions before the signal reverses. If the market makes an extreme move, i may opt to take partial profits. So it's essentially swing trend trading, but exiting and reversing when the trend changes.
Subscribe to:
Posts (Atom)

