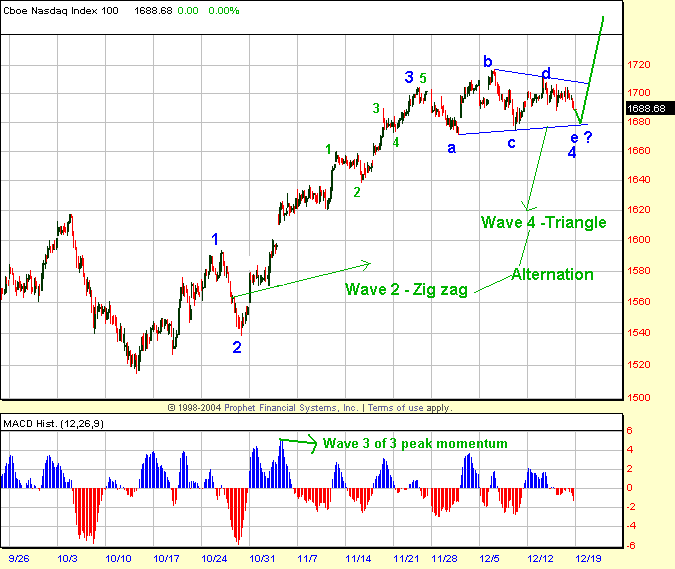
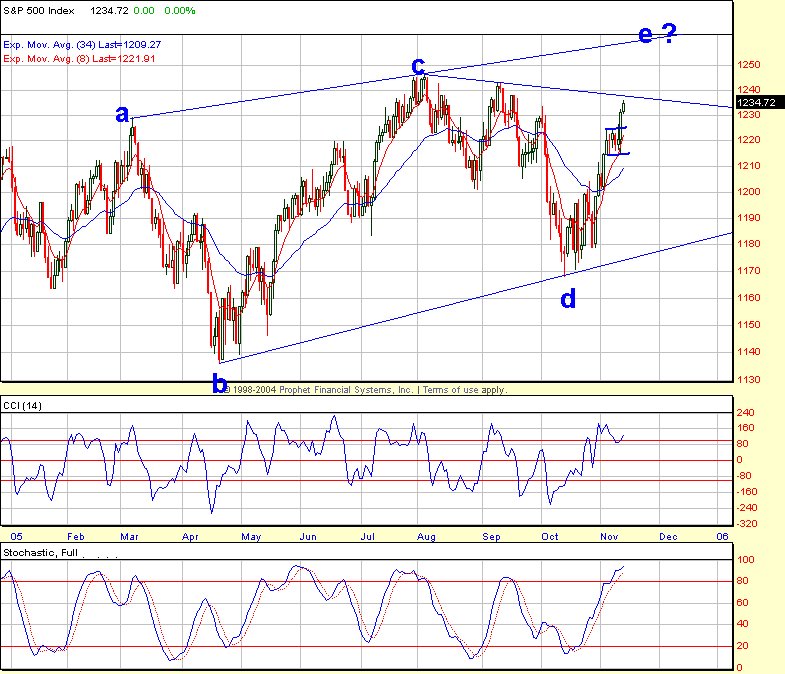
NDX sports a clear e-wave count, following all elliot rules, chanelling and alternation. If the lower trendline of the triangle gets taken out, then this count is wrong.

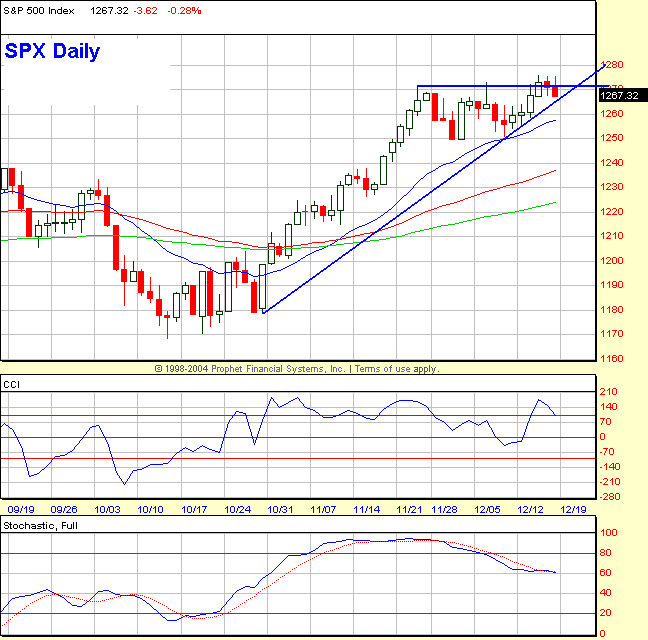
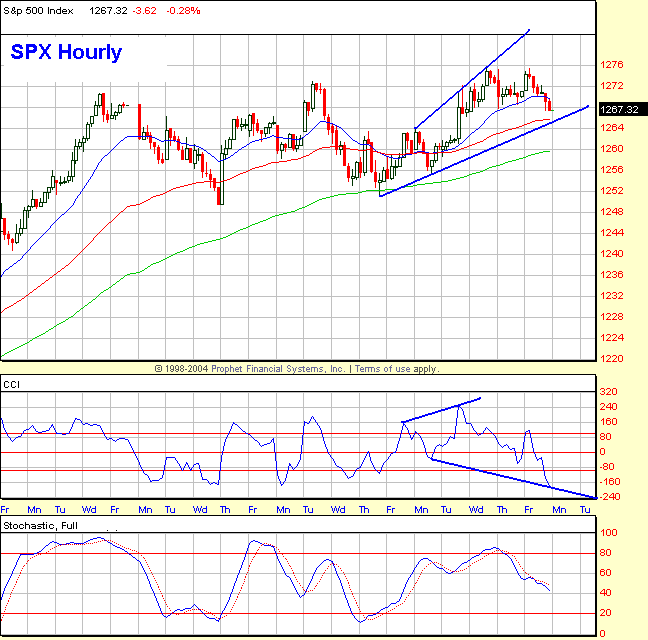
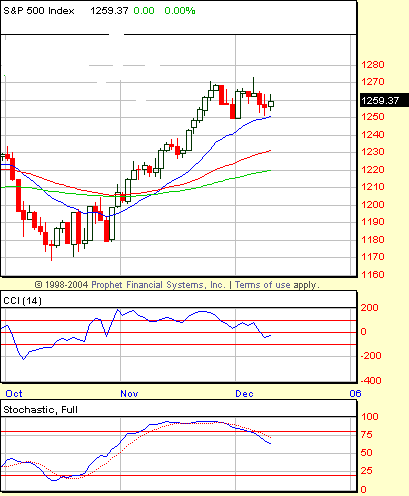

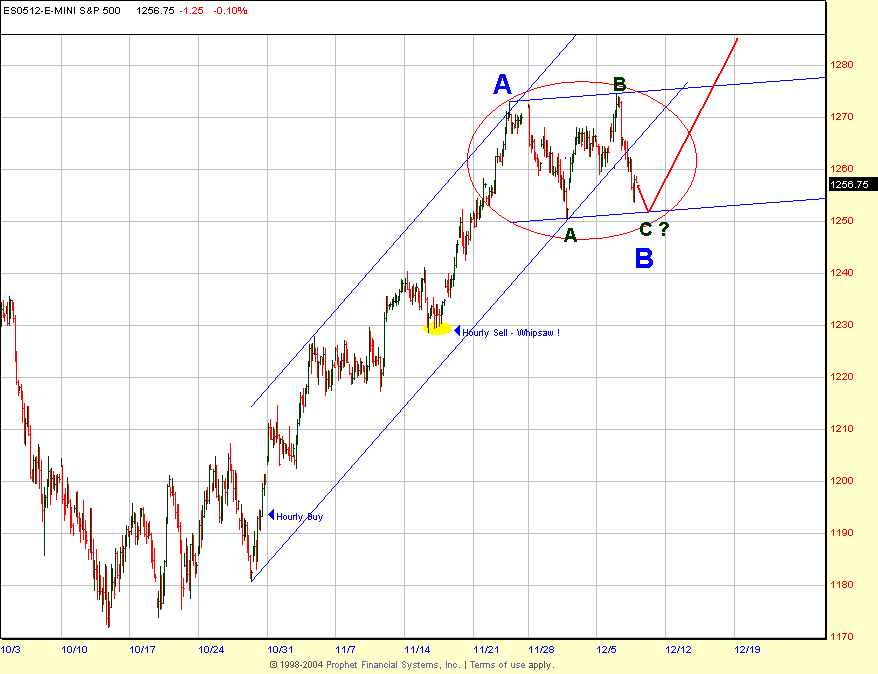
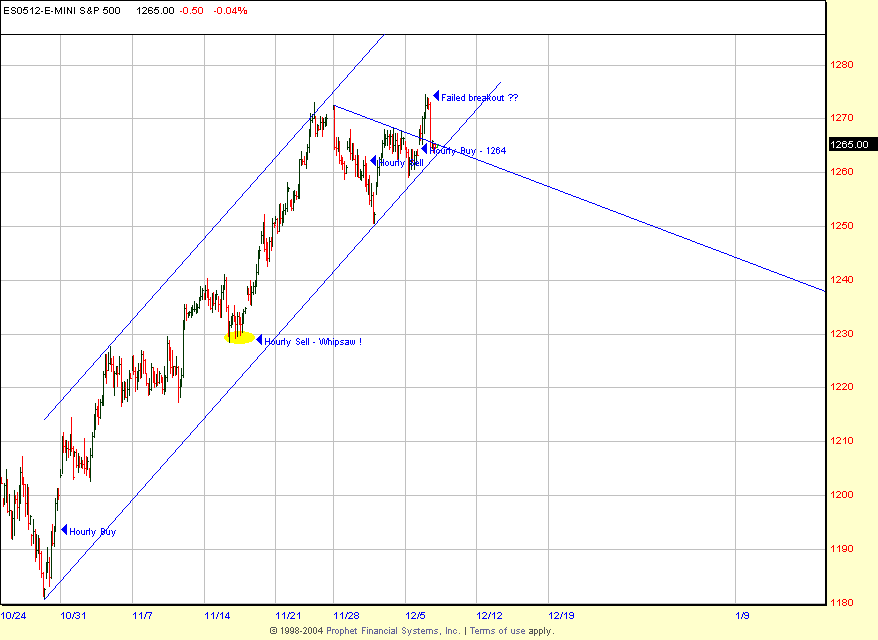
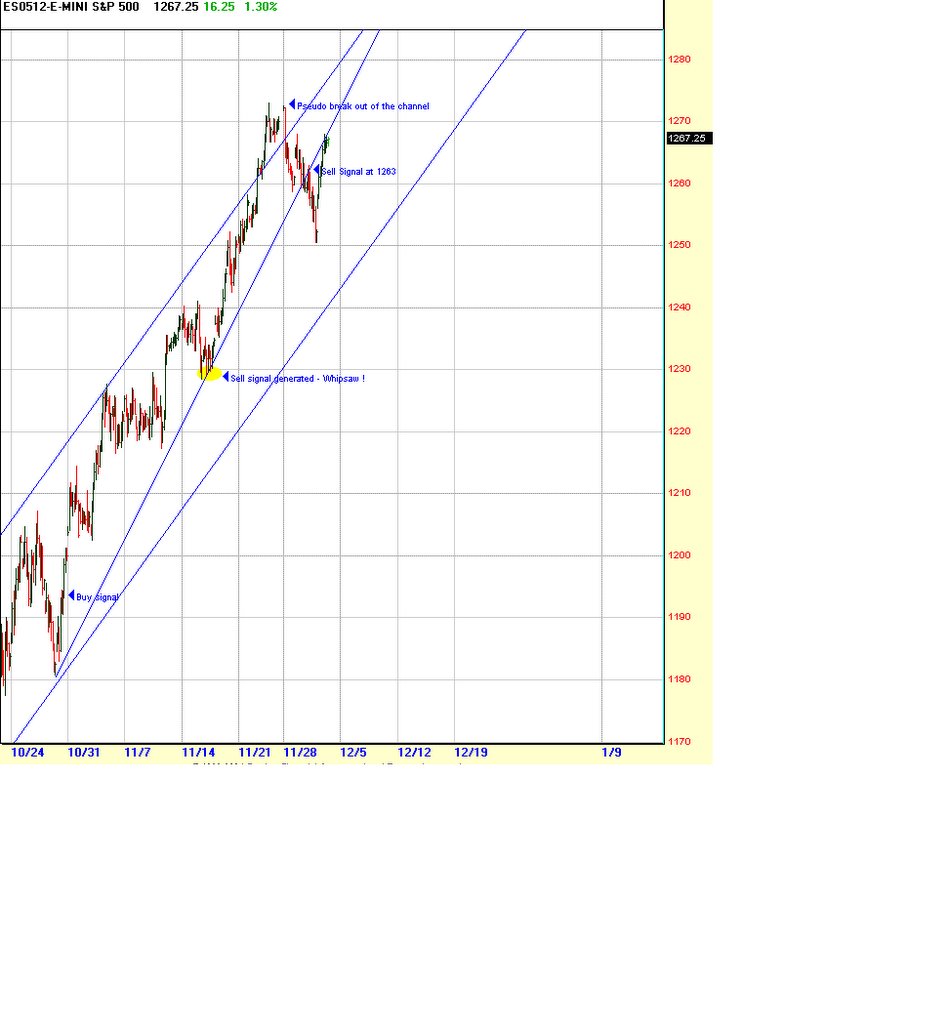

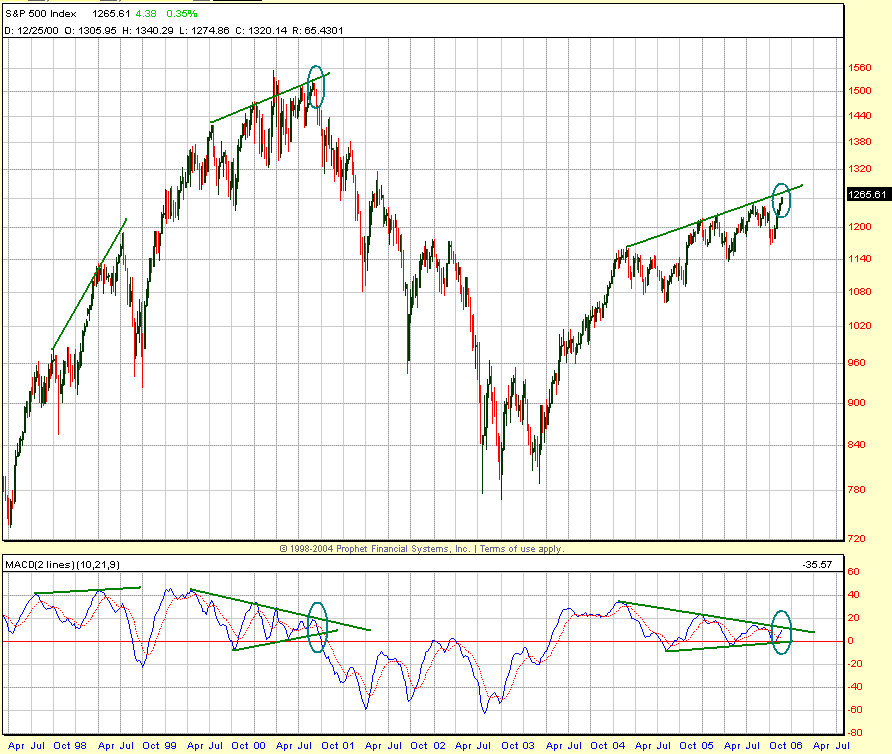

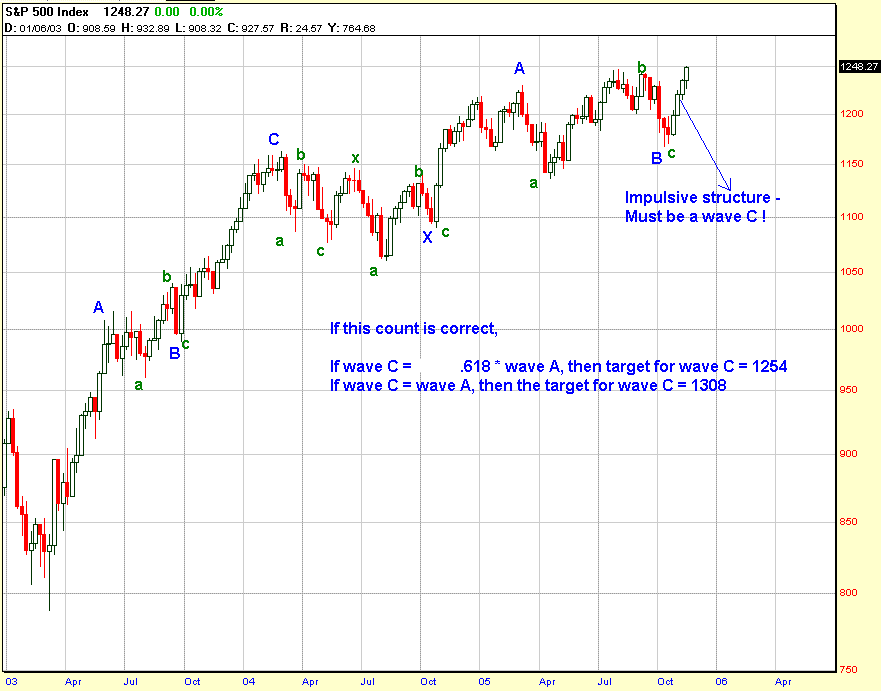
After much analysis, examining the relationships betwen the different waves in the wedge, i have come to the conclusion that what is transpiring here is not a wedge, but a double zig-zag from march 03. Ending diagonals have specific relationship between waves i.e wave C=.618*wave A and wave E = .618 * wave C. Not only do we not see this relationship here in the wedge (which has become a popular count among the e-wavers), but also the current structure from the Oct 05 bottom is looking pretty darn impulsive. Based on this new wave count, there are two potential targets for wave C (1254 and 1308). This wave C should conclude the first leg of the Bull market from the March 03 bottom, leading to a large decline into 2006 and 2007.

Signals
Daily - Buy, Weekly - Buy, Monthly - Buy
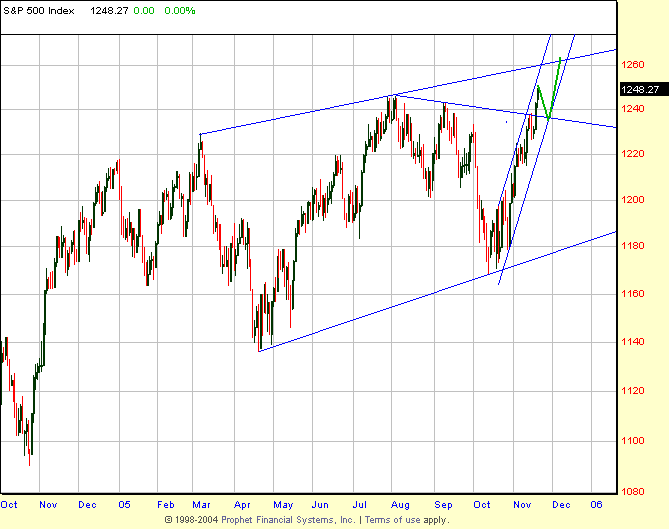
So far the price action is very constructive for a bullish up move here. The breakout of the rectangular consolidation last week has a measured move to spx 1260. However the daily and the hourly are very overbought here. So a sideways consolidation and another breakout to 1260 appears very likely. The breakout above the downtrend line will almost assure that the A-C-E trendline will be tagged. I am not married to the measured move targets here. Given how the weekly and the monthly are positioned here, any daily sell signal here should be treated with respect.


