Friday, February 10, 2006

Wedging in - But no turn yet !


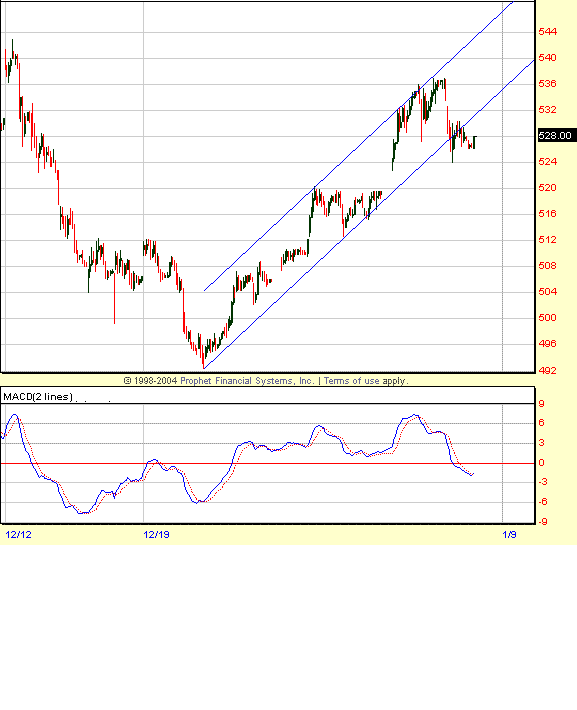
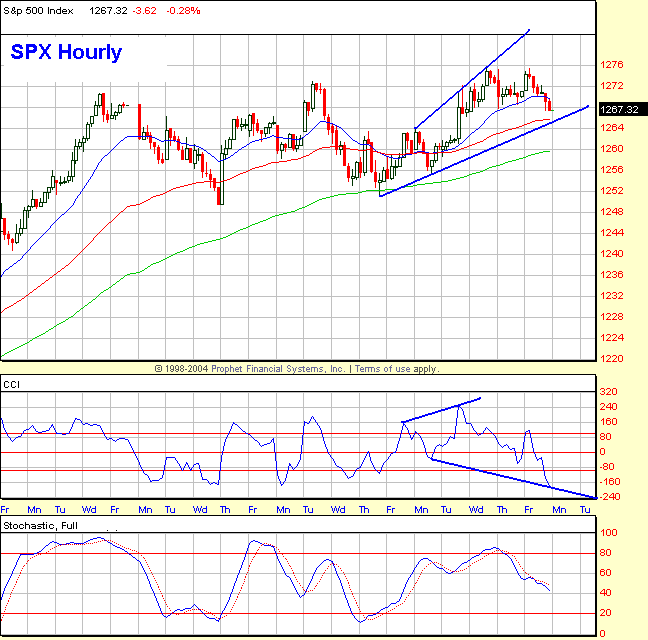
My system remains on a daily sell both on a trend and momentum basis. Based on the chart above, the market appears to be trapped in a descending wedge formation (both the price and momentum oscillators). The momentum oscillators have expended a lot of energy, but barely any price damage has been done. This is typical momentum signature of a market's move when it reaches exhaustion. Bearish e-wavers could call this as a series of 1s and 2s ie market coiling up, before the big 3rd of 3rd move comes. It cannot be ruled out though. If that's the case, we should see a big price move and the momentum oscillators should pierce thru the lower trendlines of their respective wedges. Looking at the internal structure of these waves, they are all 2-legged moves. So i woudn't bet on the series of 1s and 2s thesis here. I would rather bet on the descending wedge thesis.

On the otherhand, if we get a up move on Monday and the Price/Mom oscillators close above the upper trendline of the wedge, a powerful upmove should ensue.

In situations like this, the benefit of doubt should be given to the trend which is down currently, until it changes, and be nimble when it changes. My guess is we do some backing and filling here, test the lower trendline of the wedge and then break out of the wedge to the upside.

Bottomline, no turn yet ! - Still on a sell....

Tuesday, February 07, 2006

Still on a sell

Nothing much to add here other than the sell signal from 2/2/06 holds. The next dynamic support on the SPX cash comes around 1244 on the daily charts. Once the 1244 support is tested, i will start looking for a buy signal at that point. So far there's no bottoming action to speak of. So let's give the benefit of doubt to the downtrend.

As a side note, there's too much dumb money shorting this market. Advisors are very bearish. There's too much talk about the expected 4-year cycle bottom this fall. All this means the 4-year cycle bottom this year will be a muted affair in my opinion, not the mega decline many are expecting.

Thursday, February 02, 2006

SPX Sell signal at close


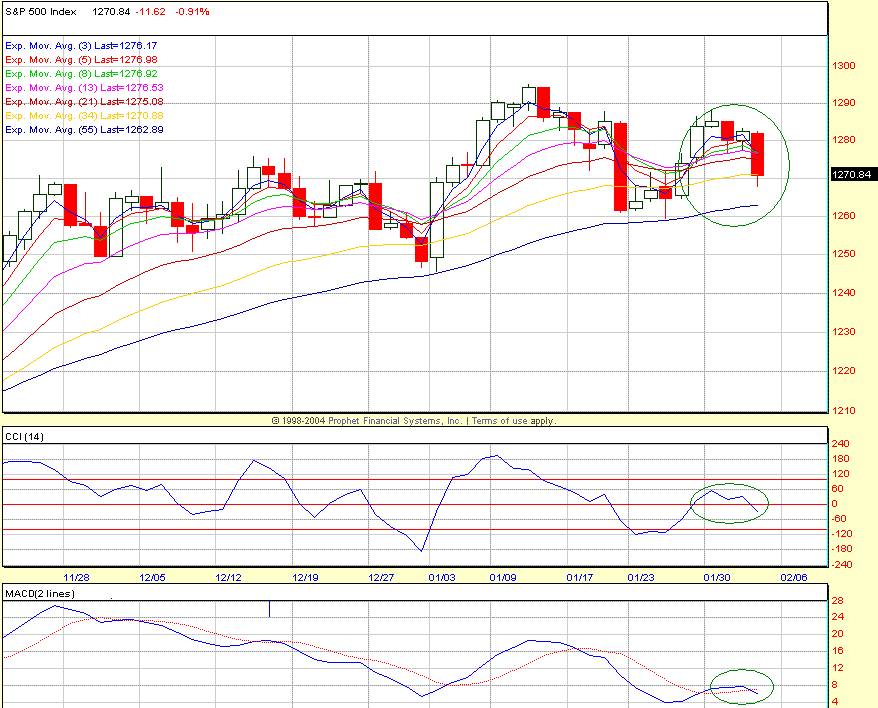
My system generated a sell signal on SPX at close. Look how the ribbons curled back down below. The CCI briefly went above zero flirted there for a couple of days and now it's back below zero again. My MACD indicator also had a crossdown. All point to a retest failure and what i call as a secondary sell signal. Classic whipsaw action. Reminds me of 10/04/05.

Nasdaq and NYSE MCOs turned back down below zero again, pointing the respective summation indices down. What a difference a day makes ! Yesterday it seemed like a hourly breakout on the DOW, which turned out to be a big fakeout.


Let me make it clear. My job is not to predict the future or provide target projections. It's to identify the trend reversal points and align with it. My system has done a darn good job in identifying the reversals. Here's the daily buy/sell signals for 2006:

1/13/06 - Sell
1/26/06 - Buy
2/2/06 - Sell

Can we get a whipsaw again ? Sure we can. It's not my job to predict the signals from my system. I don't anticipate my signals nor do i double guess it, when i get one. I have paid dearly when i have done that in the past. Right now we have a sell and let's go with the flow, until it reverses.

Wednesday, February 01, 2006

Reverse head & shoulder breakout on the hourly


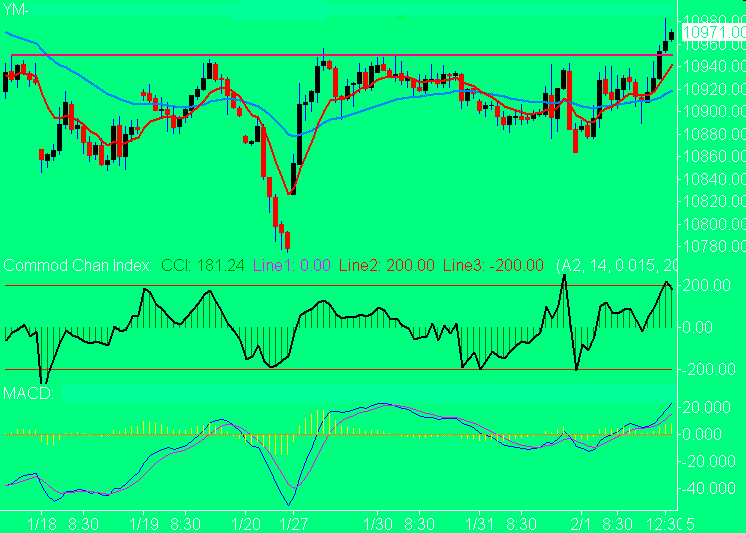
The daily on the SPX and DOW remains on a buy. We have an interesting pattern in the DOW. Seems like we are breaking out of a reverse Head & Shoulders patters, which means there's another 150-200 points on the upside left before any serious correction kicks in. Above is the hourly chart of the YM (Dow E-mini), which shows the breakout.

Sunday, January 29, 2006

Banging into resistance - Critical Juncture


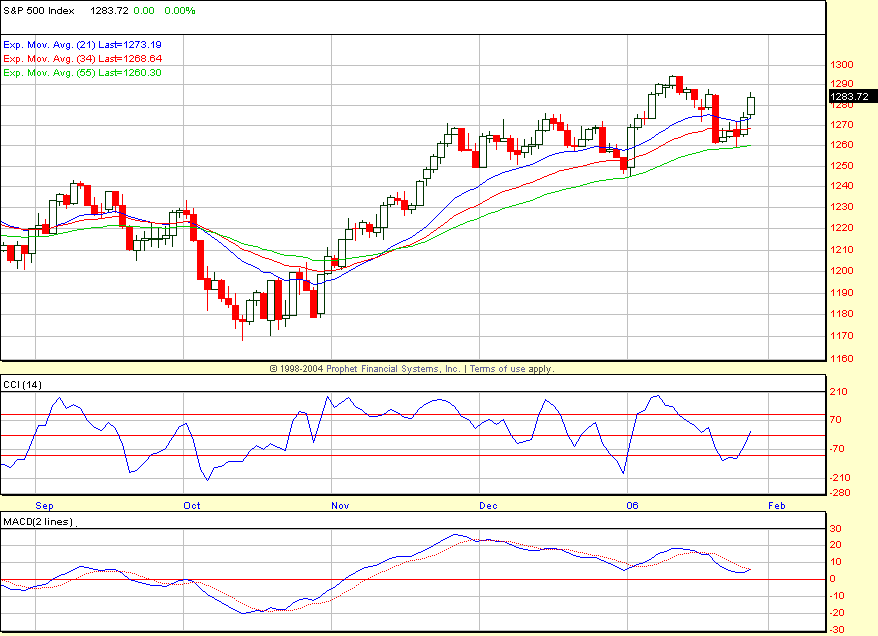
On 1/26/05, my system generated a buy signal. Yesterday's follow through strengthens the signal. now we are at a critical juncture as far as momentum is concerned. In the above chart, notice the CCI is trying to do a crossover and so is my customized version of MACD indicator. If we see a sizeable selloff on Monday, both the indicators can encounter a backkiss, which will generate secondary sell signals. I am not saying that will happen, but something to keep an eye on this Monday. The Daily trend is bullish and i will go with the flow, for now.

Thursday, January 26, 2006

Momentum buy signal at close


My system gave a momentum buy signal on SPX at the close today, on the daily timeframe. When the sell signal was generated on the SPX on 1/13, i had noted that we would go down to test the rising EMAs (34/55). We tested the 55 EMA yesterday and we had a nice green candle today on good volume and breadth.

The last few days of selling was on high TRIN, which means it was a narrow based, high volume selling in few issues (mostly the large caps), while the small caps were displaying high relative strength.

From a e-wave perspective, it appears that we have completed a irregular flat from 12/14/05.

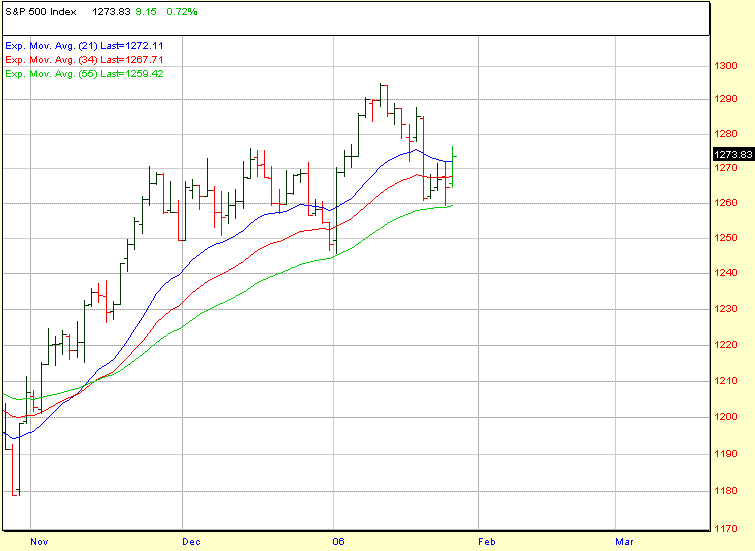
For my buy signal to be valid here, we should hold above today's low of SPX 1264.68. Any daily close below that would put the buy signal in question. Any close below the swing low for SPX at 1259.42, even on a intraday basis, will kick the system back into a secondary sell, in which case things could get nasty on the downside.

Anyways, i have a buy signal and will be looking to buy dips rather than shorting rallies as long as this buy signals holds.

Saturday, January 21, 2006

Just some perspective


Given the good breadth on the NYSE, i had thought yesterday that the divergences between the DOW and SPX would be resolved to the upside. Boy, was i wrong ! We saw a washout kind of move in all the indices. So have we topped ? Has the IT correction begun ?

It's too early to be talking about any sort of trend change here. A week back i said, when we have a momentum sell in the IT uptrend, the price comes back and tests the rising moving averages i.e the 34/55 EMAs. My own expectation from the beginning of this correction was for the price to come back and test the 34 EMA. Yesterday, we saw a failure at the 34 EMA. So the next expectation is the test of 55 EMA around SPX 1258 or we may slighly undershoot it, given the high mometum of the move.

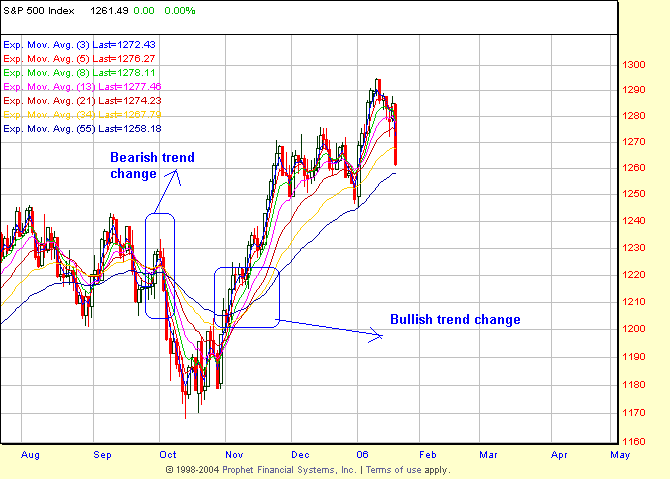
To get a better perspective of what's hapenning i have shown a ribbon chart of Fib EMAs (3,5,8,13,21,34,55). Notice how all the EMAs converge and crossover when a trend change happens (beginning and end of Oct 2005). Currently we are nowhere close to that kind of a move to even start talking about any trend change. Any talk of trend change at this point is just one person's opinion or gut feel. The price action has not yet confirmed a trend change or even close to it. A big red candle does not mean anything other than creating fear and bearishness among the retailers. Also notice how the 55 EMA flattens out as the topping process happens and as the price retests the prior highs. A retest failure and the covergence/crossover of the EMAs would be a bearish sign and a sign of trend change. We are nowhere close to that.


Anyway for the very short term, since the daily momentum continues to be strongly down and the hourly is very oversold, we should see some more downside probing, backing and filling action around the 55 EMA as the bottoming action happens. The next leg up and the strength of the move will tell us if we have indeed topped or if this move down was just another pullback in the uptrend.

Thursday, January 19, 2006

Momentum buy signal on the Daily charts

SPX and NDX gave a momentum buy signal on the daily charts. DOW is still on a momentum sell. Now the question is whether this divergences will resolve to the upside or downside. Based on how strong the RUT and SMH were today and the fact that the Mclellan Oscillators on the NYSE and Nasdaq crossed back above the zero line, odds are that the divergences will be resolved to the upside. We need to see a strong follow thru tommorow to keep the bullish case alive. Otherwise as i noted yesterday, the rising EMAs will start to flatten out, causing a potential trend change.

Wednesday, January 18, 2006

Still on a momentum sell

My system has been on a momentum sell since 1/12 and continues to be in that mode as of today's close. If we close in green tommorow, i will get a momentum buy signal on the daily again. On the other hand, one more down day tommorow will start flattening the rising EMAs and could potentially change the trend. But for now, the daily trend remains up and this is nothing more than a pullback in the uptrend. Since i trade the momentum and not the price trend, until there's a momentum buy, i will continue to play the short side of the market.

Daily - Sell
Hourly - Sell
30-min - Sell
15 min - Buy

Tuesday, January 17, 2006

3 Gap play

As posted on 1/12, if the market closes in red on 1/13, my daily momentum would kick into sell. So as of 1/13 my daily momentum has been on a sell and continues to be in that mode as of today's close. But remember the daily trend is still solidly up. When this happens typically the market comes down and tests the rising EMAs (34 or 55).

Intel report has caused a selloff after hours, which means there will be a gap down on all indices tommorow morning. The troubling part for the shorts at this point is, we have a 3 gap play on YM and ES, i.e three unfilled gaps on 1/12, 1/17 and 1/18 (unless we fill today AH selloff in the overnight session). When there is a third gap down, typically the market goes into a climactic selloff and reverses swiftly. So i am looking for some kind of bullish reversal in tommorow morning's session

Thursday, January 12, 2006

VST decline over ?

The VST 1-2 days scary decline that i posted yesterday is almost done or very close to be over. A reverse divergence setup is close to getting confirmed on the 60-min charts. Will start looking for signs of bottom and the long side tommorow. Today's decline qualifies as a wave C of the running correction.

If tommorow closes in red, the scenario could change completely, which would kick the daily momentum to a sell and a retest of the 1/3/06 lows will be in order. So i will be watching tommorows action closely to get more clues.

Both Euro and YM had great day trading opportunities today, with virtually no exit for shorts

Wednesday, January 11, 2006

Bumping against a Brickwall


There's a cluster of resistances between 1290-1300, which is unlikely to be taken out in the first attempt. So a reaction is very likely here. The markets have been moving up in a corrective advance the last few days. When the market is moving up in a corrective fashion and making new highs, it means that there's so much bullish pressure that the correction is happening to the upside instead of to the downside, which is called a running correction in e-wave terms. The strong breadth behind the move also confirms the running correction thesis. Based on the strong internals behind the advance, this leg-up is likely to continue for weeks instead of days. If SPX 1300 gets taken out, then SPX 1335 will come in a flash.


I am expecting a 1-2 day scary correction here, which will weaken the bulls resolve and bring out some mega bear warnings from the usual suspects. Then a move higher to fade both the weak bulls and aggresive bears. Same Old .. Same Old !

Saturday, January 07, 2006

Why is everyone so beared up ?


We are having breakouts on most indices with solid internals and yet there's so much disbelief. I think this whole disbelief in the rally stems out from the fact that the majority are now looking for the 4-year cycle bottom in 2006, which is a very widely publicized event. The wide acceptance and positioning for this event makes it a slim probability occurence now. Look what happened to the much publicized 80-week cycle bottom that was furiously discussed last week.
Instead of asking why the market is rallying in face of the current fundamentals or why it shoudn't be rallying as theorized by the market letter writers, one has to look at what the internals are suggesting.

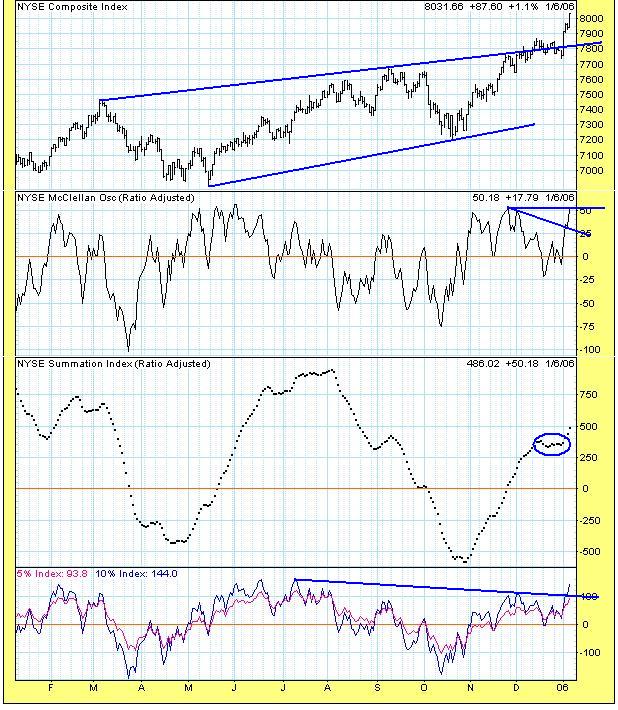
Take a look at the above chart of NYSE. Price has clearly broken out of the wedge that so many have been discussing. This whole wedge theory has been clearly invalidated at least on the NYSE. I noted a month back on this blog why the wedge theory is bogus, given the interrelationship between the the different wave components in the wedge, which doesn't confirm to the Ending diagonal requirements.

The 5% and the 10% components of the MCO have already taken out the Nov 2005 highs. The NYSE MCO is close to taking out the Nov 2005 highs. If this happens then the bears looking for an intermediate or a long term top will be dissapointed here. The summation index has formed a ledge and is now moving higher, which is again a very bullish sign. I don't see any reasons to get bearish in the face of such solid internals. In fact such bearishness here can only lead to one heck of a rally. The system is awash with unprecedented liquidity and don't fight it.

The Hourly/Daily/Weekly/Monthly trends are all up. In the VST we are very overextended. So, we may get a small pullback starting Monday, but every pullback is a buying opportunity at this stage until the current technicals/trend change.

Thursday, January 05, 2006

Bearish setup on GOLD

Two charts says it all !


As far as SPX is concerned it's a tough call. One has to play by the ear. It appears like a rectangular consolidation on the hourly charts and ready to breakout. But the hourly is ovebought and some retracement is due, before the next leg up. Also a 80-week cycle low is due around Jan 13.

Wednesday, January 04, 2006

Bear market rally theme continues

Before i left for vacation, i said that there was some more downside work left and it appears that the downside work is over.

The rally theme of the last 3 years continues. Every reaction off of the top is taken as the next mega bear decline signal. The system gets clogged with shorts and the programs kick-in and squeeze the juice out of the bears. It was surprising as to how much bearishness was seen on the message boards over the last couple of weeks for a mere 30 point decline on the SPX. Bears arguments are getting more and more fundamental rather than technical, justifying for a big decline to come. Two arguments at this stage are the expected 4-year cyle bottom in late 2006 or early 2007 and the latest being the Yield curve inversion, a precursor to a recession.

However, the technicals tell a different story. The daily MACD is comfortably above the zero line impyling that the bullish uptrend is still intact for now. We may have seen a zero line reject on the MACD yesterday which means that the next leg up might have begun. It's a tad early to say that, but based on the size of the move and the technicals, i think the odds are that the next leg up is underway.


From a e-wave perspective, i think yesterday we finished the wave B of an expanding triangle and wave C is now underway. Until more confirmation comes, i will have to give some weight to the alternate count as well. My alternate count is that yesterday was a news induced rally (a wave X) with another A-B-C downleg yet to come. If my alternate count is true, we should find support around the SPX 1230 levels. At this stage, i will wait for a retracement and see how it plays out, before commiting to either count.

For now, the hourly trend and momentum is up and will look for day trades in that direction. The hourly is getting overbought here, so some sort of retracement/consolidation of yesterday's move is to be expected here.

Saturday, December 24, 2005

Happy holidays all !

No updates till 1/2/06.

Happy holidays all !

Wednesday, December 21, 2005

Bearish Backkiss on the hourly charts


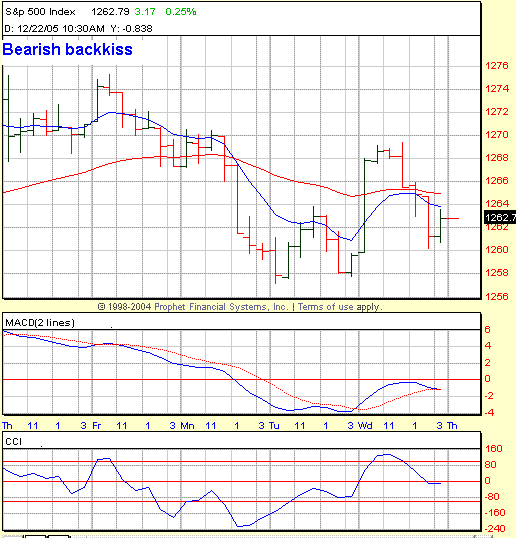
As i mentioned on Monday, the 120-min on NDX was in a deeply oversold condition and a bounce was overdue. Today we bounced hard but reversed nastily into the close, creating a bearish backkiss on the hourly EMAs and a zero line backkiss on the MACD. This suggests that there's more work to be done on the downside. Today's high should remain intact for the bearish case here. If today's highs are taken out, it would confirm a reverse divergence setup on the daily charts, which would lead to new recovery highs on all the indices. I doubt that's the case given the rally failure today, but it helps to be open minded when it comes to trading.

Overall we remain in a overlapping choppy market. So these days i tend to trade the 15-min and hourly charts to maximize gains. Trading is not really a sophisticated game that requires one to use Fractal geometry, Parabolic curves, Gann angles, Neural networks Fourier analysis, Spiral calendars et al to make money. They all look sexy on the charts, but not add much to the trading bottom line. Throw in a bunch of EMAs to follow the trend and moementum indicators to signal the reversals and you are all set.

Good luck trading and happy holidays.

Monday, December 19, 2005

Hourly sell on all the indices


The hourly went on a sell on all the indices today - DOW, SPX, NDX and RUT on both momentum and trend basis. There were no-brainer setups to go short today, if one followed the 15-min charts. Here we are in a seasonally bullish period and technically awful looking markets.

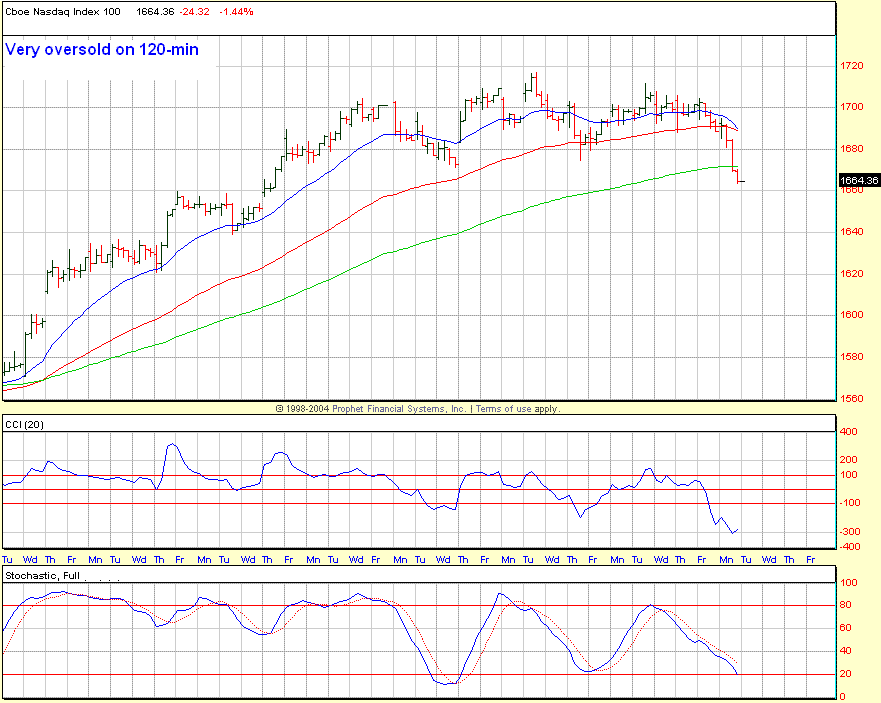
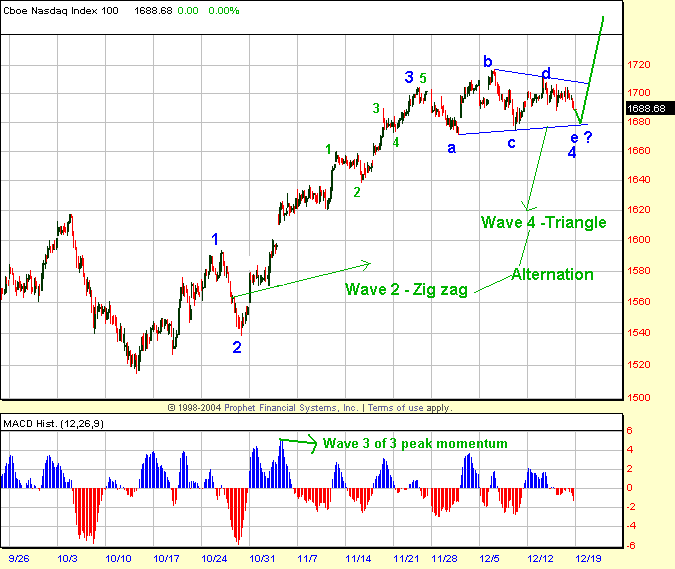
The e-wave count on NDX got invalidated as soon as we broke below the lower trendline of the triangle. That's why it pays to watch the momentum indicators and not get married to the wavecount. The 120-min on NDX tells the story for today, which is extremely oversold. A -300 reading on the CCI(20) and it has hooked back above it. The Full Stoch is almost oversold.

The daily on the NDX suggests two possibilities, either a slingshot reversal from here or a trip to 1640-1645 where it meets the 60 EMA, just to get everyone beared up and another attempt at nominal highs. If we were to make any nominal new highs on the indices here, the upmove have to be swift i.e a slingshot kind of move. Instead if we churn sideways after the decline, the bear has started....


The daily CCI on the SPX is right near the zero line, where a reversal can start anytime. I am not too beared up on DOW and SPX at this point as far as swing trading is concerned. Both are right at the support zones. If we fail here, then 1240 (SPX) and 10680 (DOW) would be next major support zones.

Saturday, December 17, 2005

NDX - E-wave count


NDX sports a clear e-wave count, following all elliot rules, chanelling and alternation. If the lower trendline of the triangle gets taken out, then this count is wrong.

Friday, December 16, 2005

SPX - Weekly, Daily, Hourly

My anlaysis is based on Trend and Momentum. Best signals come when both are in Sync. Blind trend following is dangerous. Look what happened to Gold last week. The upward trend was intact, but the momentum clearly gave a sell signal. Those who ignored the momentum got clobbered.

There's been a lot of top picking and top calling in the stock market. Let's examine what the markets are saying.

SPX Weekly - Momentum buy, Trend Buy


The weekly picture is very clear. We have a weekly breakout and the market is consolidating above the breakout line. Look at the CCI, which is yet to show divergences with the price. This most likely means the top is at least another 1-2 weeks away. The weekly Full Stoch is also rising and no crossover there.

SPX Daily - Momentum Buy, Trend Buy


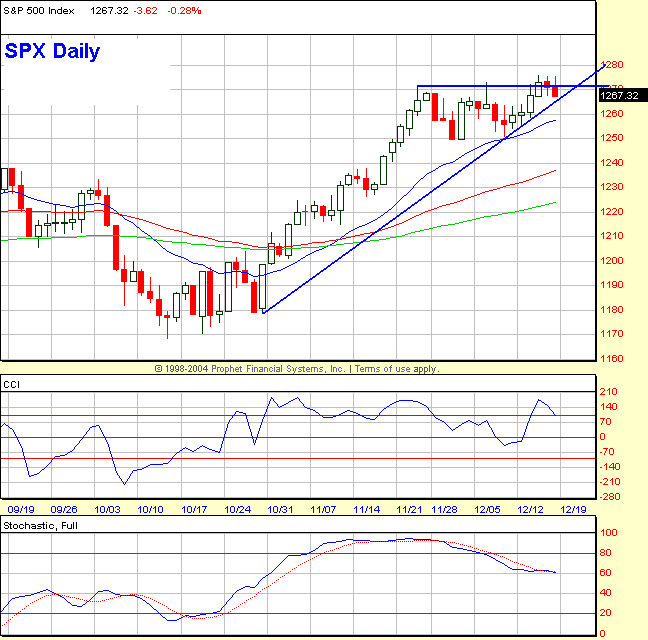
The daily trend is up as evidenced by the EMAs and the trendline itself. The daily chart is a bit of concern in the ST term. The price is perched on the trendline, break of which could lead to the retest of recent lows. So far we have had 4 failed breakout attempts. Again we need momentum divergences here, which has not yet been established.


SPX Hourly - Momentum Sell, Trend Buy


Hourly chart is suggesting some sort of expanding formation here. Look at how the CCI is going from extreme to extreme, which is typical of an expanding environment. In a contracting environment, the CCI keeps oscillating around the zero line. Hourly is on a momentum sell, but is still a buy on a trend basis. If we take out the trendline from 12/8, we could see some serious selling, causing the EMAs to slant downwards and create crossovers, issuing a trend sell. Until the Trend and momentum are both on sell, it's a weak sell and one tends to accumulate a lot of false signals in the long term by taking those weak signals.

So for VST, i will go long on Monday, if we get a hourly momentum buy. If the hourly trend turns down, i will go short.