Tuesday, October 17, 2006
Three strikes and....
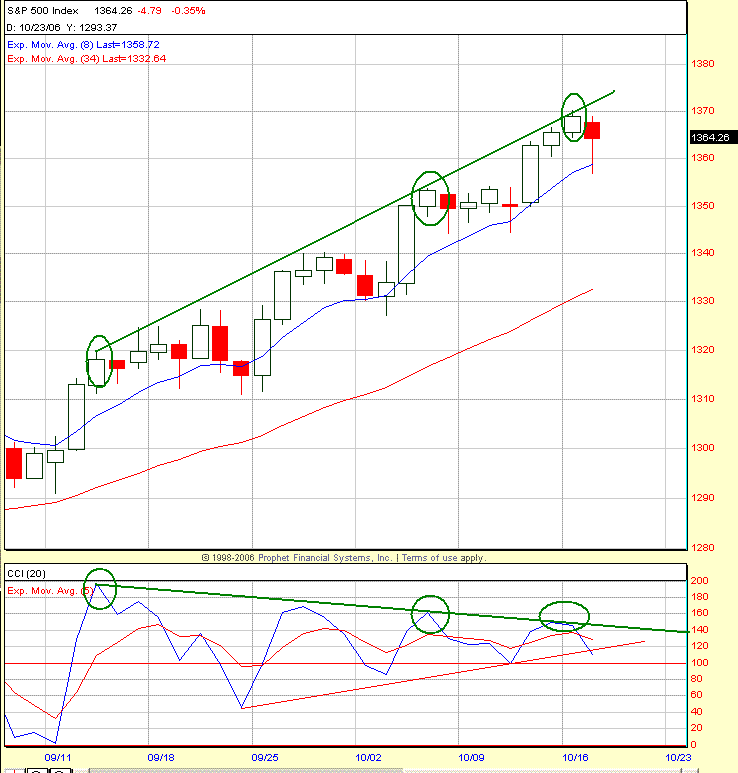
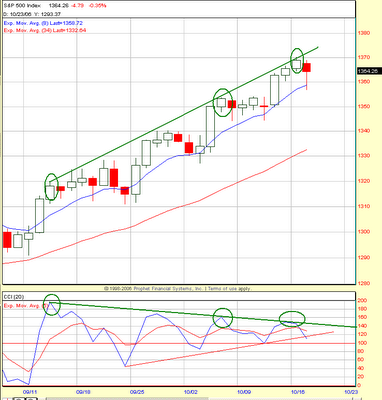
My system missed a daily sell signal by a hair's breadth today. As i said in my weekly comments, we are in the intermediate term topping zone and we could fall off the bed anytime here. One chart says it all !


Friday, October 13, 2006
Intermediate Term market thoughts
My system genearated a Weekly buy signal on the SPX on Aug 6, which i posted on traders-talk.com.
http://www.traders-talk.com/mb2/index.php?showtopic=57534&hl=weekly+buy
There were a lot of disbeleivers then and the disbeleivers in the current rally continues. I have been playing the long side since then, but now the IT is getting long in the tooth. So the free ride is essentially over and the risk of an unexpected selloff increases as we complete this topping process. In the VST, i expect a selloff to near 1240 and then another leg higher. The 120-min momentum needs to rollover for the 1240 scenario to work. Otherwise, we could blow off straight towards 1288.
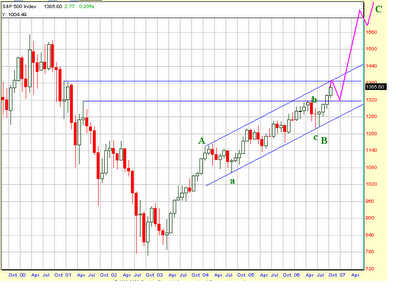
To get a perspective of what's happening. Wave A from the 2003 lows ended in March 04. Since then we have been building this massive upward sloping siwdeways flag, an irregular flat in elliotwave terms. This massive sideways flag which we most likely finished with that plunge in May-June 2006, was the wave B. Now we have very likely embarked on an intermediate degree wave C which should go up and eventually take out the 2000 highs on the SPX. Initially i thought that the wave B was not finished and we would move down and retest the June 06 bottom to fill all the gaps. It still is not beyond the realm of possibility !
My latest thinking is that we are very unlikely to retest the June 06 bottom anytime soon. The recent advance has been the fastest (not yet the largest wave), since the corrective wave begun in 2004. Now the speed of this advance and the angle of ascent is loudly saying that a new impulsive wave to the upside has begun. The design of the wave C is unknown at this point and could either be a true impulse i.e 5 waves or a terminal wave C. More time and price action will be required to confirm the structure of wave C.
As for the near term, the IT advance from June lows is now getting long in the tooth. We are bumping into some serious resistance from the channel containing the corrective wave from 2004 as well as the resistance from Dec 2000 monthly high. Look how nicely they are converging near 1388 SPX cash. Gotta love TA. This twin resistance will prove formidable to overtake on the first run. So essentialy we are in a topping zone from SPX 1365 to 1388. A reaction could start anytime fom this topping zone. How low the reaction would take us, is a crapshoot at this point. It could find support at either the 38% or 50% Fib retracements to the June lows. So our support zone for any reaction here should come between 1300 - 1320 SPX cash.
It's amazing how sentiment works. All these days when we were miles away from all these formidable resistances, there was so much scare in buying the dips. Now that we are approaching the same resistances, there's no fear. It's all about parabolic rises, primary degree wave 3 of 3(which is a baloney IMO -will post more on that), epicenter, blah, blah, blah. Show them a 20 point reaction and all the parabolic talk will change to Nikkei crash, 87 crash, 29 crash.....
http://www.traders-talk.com/mb2/index.php?showtopic=57534&hl=weekly+buy
There were a lot of disbeleivers then and the disbeleivers in the current rally continues. I have been playing the long side since then, but now the IT is getting long in the tooth. So the free ride is essentially over and the risk of an unexpected selloff increases as we complete this topping process. In the VST, i expect a selloff to near 1240 and then another leg higher. The 120-min momentum needs to rollover for the 1240 scenario to work. Otherwise, we could blow off straight towards 1288.
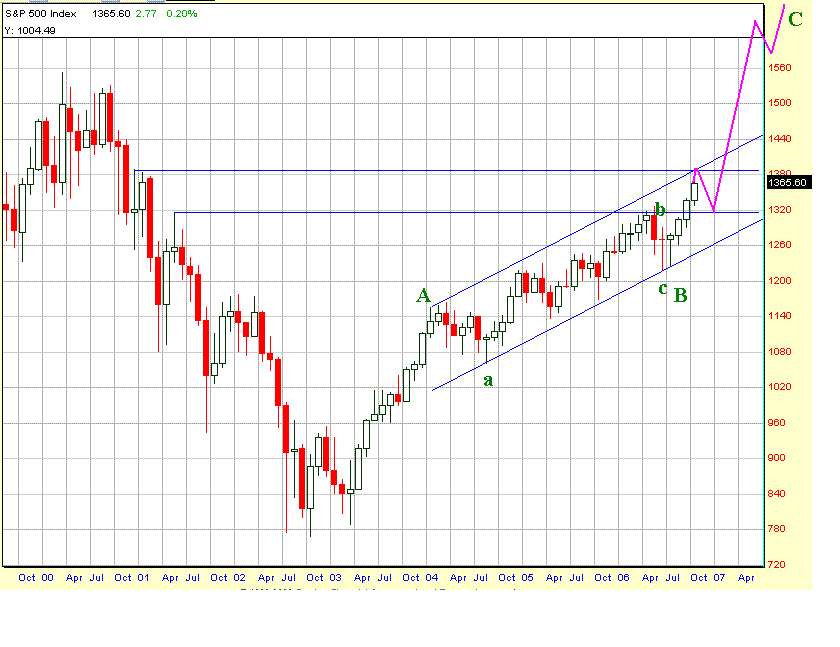
To get a perspective of what's happening. Wave A from the 2003 lows ended in March 04. Since then we have been building this massive upward sloping siwdeways flag, an irregular flat in elliotwave terms. This massive sideways flag which we most likely finished with that plunge in May-June 2006, was the wave B. Now we have very likely embarked on an intermediate degree wave C which should go up and eventually take out the 2000 highs on the SPX. Initially i thought that the wave B was not finished and we would move down and retest the June 06 bottom to fill all the gaps. It still is not beyond the realm of possibility !
My latest thinking is that we are very unlikely to retest the June 06 bottom anytime soon. The recent advance has been the fastest (not yet the largest wave), since the corrective wave begun in 2004. Now the speed of this advance and the angle of ascent is loudly saying that a new impulsive wave to the upside has begun. The design of the wave C is unknown at this point and could either be a true impulse i.e 5 waves or a terminal wave C. More time and price action will be required to confirm the structure of wave C.
As for the near term, the IT advance from June lows is now getting long in the tooth. We are bumping into some serious resistance from the channel containing the corrective wave from 2004 as well as the resistance from Dec 2000 monthly high. Look how nicely they are converging near 1388 SPX cash. Gotta love TA. This twin resistance will prove formidable to overtake on the first run. So essentialy we are in a topping zone from SPX 1365 to 1388. A reaction could start anytime fom this topping zone. How low the reaction would take us, is a crapshoot at this point. It could find support at either the 38% or 50% Fib retracements to the June lows. So our support zone for any reaction here should come between 1300 - 1320 SPX cash.
It's amazing how sentiment works. All these days when we were miles away from all these formidable resistances, there was so much scare in buying the dips. Now that we are approaching the same resistances, there's no fear. It's all about parabolic rises, primary degree wave 3 of 3(which is a baloney IMO -will post more on that), epicenter, blah, blah, blah. Show them a 20 point reaction and all the parabolic talk will change to Nikkei crash, 87 crash, 29 crash.....
Sunday, September 24, 2006
LONG TERM MARKET THOUGHTS
Firstly, i truly beleive that future cannot be predicted, be it the future of stock market or the economy or our lives. Hence one cannot make one's life's decisions based on those forecasts. So the implication is one cannot trade one's forecasts, but should only trade the trend, based on sound money management. However, i truly beleive that the future path of the market can be probabilistically predicted with high odds of success. From various TA methodologies i have studied, i have found e-wave theory to be the most useful for making long term market projections.
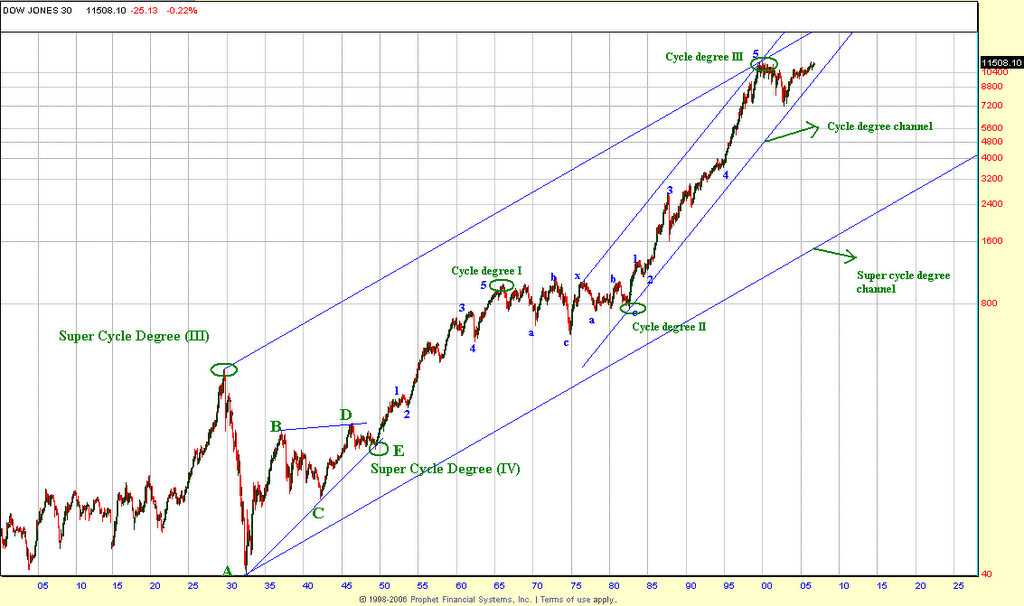
Here's my big picture e-wave count. I will reserve the detailed explanation and reasons behind this e-wave count for another article.
To see an enlarged version of the charts below, please click on it
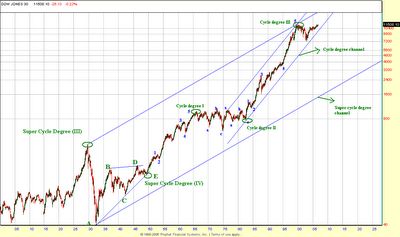
IMO the current bull market has a couple of more years of run-up left, before any large correction kicks in. I beleive that we are in a Cycle degree wave 4 correction. The last Cycle degree correction (Cycle degree wave 2) lasted for 16 years between 1966-1982. Since i beleive this to be a Cycle degree wave 4 correction, if this correction should take the same time as wave 2, then it should end somewhere around 2016. Although i agree with the bears that this correction will end somewhere around 2014-2016, i part ways with them when it comes to how that correction is going to unfold and where that bear market bottom is likely to form.
There are three schools of bearish thoughts today.
1) Secular bear market
2) Mutli cyclical bear market
3) Cyclical bear market
Secular bear market
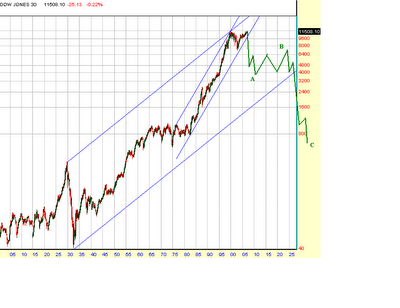
The first school "Secular bear market" folks are armageddonists, who beleive a Grand super cycle degree top has formed in 2000 and we should eventually break below the secular lows of 1982 at DOW 769. This school comprises primarily of deflationary depressionists. Even before we start talking about a secular bear market, we should at least break below the Oct 2002 lows. Until then this school of thought is an arena of TA fantasy and/or delusion.
Multi-cyclical bear market

The second school of thought beleives that we are in a secular bear market, yet they can't take the leap of faith a la Prechter to call for market lows below the prior secular bottom at 1982. It's kind of oxymoronic to call we are in a secular bear within the context of a secular bull, without calling for price lows below the prior secular lows of 1982. Although the term "Secular" is loosely bandied about by this scool, they are in fact calling for a multi-cyclical bear market. Obviously this school defines the secular bear in terms of time, by being non-commital on price. This school has a combination of deflationists, hyperinflationists and kondraitief theorists.
Cyclical bear within a Secular bull
The third school (includes me) believes that we in a secular bull market, but a cyclical bear is unfolding in the context of a secular bull. The very fact that the S&P 500 suffered a 50% correction, the largest correction since the advance begun in 1982, means that the secular bull from 1982 has ended. A secular bull ending does not put us automatically in a secular bear. The end of the secular advance has given birth to a cyclical bear, once complete, should start another secular advance.
What's happening now ?
Bears argue that the bear market did not end in 2002. Two main reasons often cited are that we did not see the capitulation in terms of sentiment compared to the prior bear market lows. The P/E did not revert to the historic mean or to the levels seen in prior bear market bottoms.
But one has to remember that cycle degree corrections are rarely simple A-B-C type corrections. Bull market often begin with as few folks on its back as possible. We live in an information age and every average bear out there knows that you buy stocks for long term when there's blood on the streets. Every average bear knows that the time to invest for the long term is when the P/E reverts back to single digits, like it did in 1982. Every average bear knows that a wave C will follow a wave A. In other words, there's an army of wannabe Warren Buffets waiting for the blood on streets to buy this market with both the hands. As the market keeps advancing relentlessly, as it has been since the 2002 lows, the bearish emotion and bearish frustration keeps rising. The thinking among the bears predominantly today is "I am smart and will wait in cash. Let the lemmings be led. When the bulls lose their shirts and the P/E revert to the bear market bottom levels, i will buy cheap". Will the market accomodate this army of bears waiting to buy cheap or shorting this market recklessly ? If history is any guide, these folks will capitulate big time, right near the market top. Market has its own devious ways of keeping most folks out the market.
Bull markets do not begin when the economy is in a state of utopia. It needs that constant wall of worry, to keep the majority from participating. I think the housing market decline over the next few years from the mania top of 2005 will provide fresh fodder for the bears to worry and the wall of worry for the bull market to climb. In my opinion, the housing and the deteriorating economic fundamentals going forward will be the hook which will keep the majority from participating in the bull market going forward.
The best way to predict the stock market IMO is to look at the stock market itself. You can't predict the stock market by looking at Bonds, Dollar, Gold or even the Economy for that matter. Although correlations exist between these markets, those are not static correlations, but one which changes over time. What was the stock market saying in 2002 Oct ?. Well, it was a screaming bear market. Being bearish then was the right thing to do. Bears extrapolated the market decline into the end of civilization. The market demise was predicted with rational certainity using various TA methodologies, but all arriving at the same conclusion and the same dates for dark ages. All archived discussions at longwaves.net should be an eye opener for all the new bear cubs that are being born today. What went wrong with these folks ?. ("These folks" include me as well - i was a raging bear then !). Kondraiteif winter, a wave 3 of 3 down, currency collapase, a depression that would put 1929 to shame, credit implosion, housing bust, breadlines et al ? I think the problem lies in trying to predict one unknown variable with another unknown - The two variables being economy and the stock market.
Where are we now ?
The monthly trend turned up in the stock market in the fall of 2003 and since then we have been in a bull market. I went back and searched as to what happened when the monthly trend turned up after a crash or a major selloff. I have shown five examples here - 1929 DOW crash, 1987 DOW crash, 2000 S&P meltdown, 2004 BSE (Bombay stock exchange) crash.
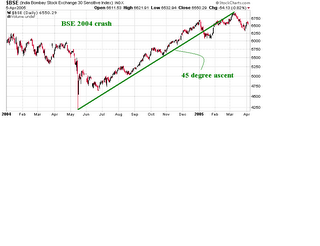
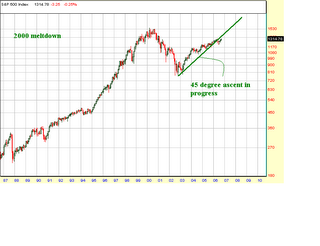
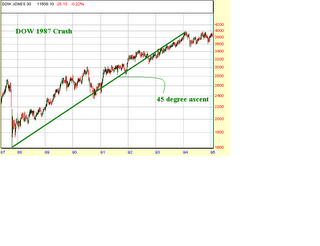
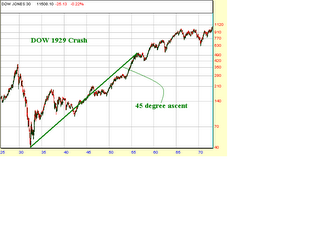
They all exhibit the same characteristic. Once the monthly trend turns up from a "crash bottom", they start a 45 degree ascent, slowly grinding sideways to up, keepping the bears hopes alive. The momentum divergences on the monthly charts keep the bulls from not talking any long term bets. The 45 degree ascent also is a psychological barrier for making long term bets as it looks ugly on the charts. The e-wavers keep calling it a corrective advance until new recovery highs are made. The memories of the prior meltdown also makes it difficult to make long term bets. Essentially the majority shys away from making long term bets, which results in a choppy sideways-to-up grinding markets without a sustained trend on the daily charts. However the trend is clear and visible on the monthly charts. This market profile/structure and the associated psychology makes sure that the majority is out of the bull market and market keeps climbing the constant wall of worry without creating euphoria quicky.
The slow sideways advance also helps to correct the P/E ratio downwards. As we have seen the S&P has advanced nearly 550 points from the 2002 lows, while the P/E has been declining. Now as long as the stock market keeps advancing at a slower rate than the earnings growth, we could end up seeing a P/E in the low teens or even single digits, at all time highs on the SPX. Imagine the horror among those waiting to buy this market at low P/Es, when forced to buy at ATH on SPX. Of course, i am just extrapolating what has happened from 2002 lows going forward, which may or may not happen - but is not something beyond the realm of possibility, given what has happened so far !
Now how can a corrective structure/advance take out the prior market highs ?
Under e-wave, we have upward biased corrective structures and downward biased corrective structures. Flats and Zig-zags are downward biased corrective structures in an uptrend. What most bears are expecting today is a regular flat or zig-zag taking us below Oct 02 lows.
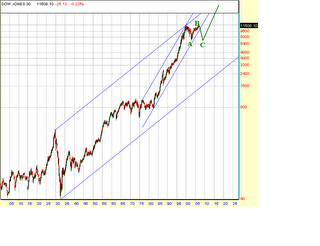
Running Flat (or a irregular flat ) and Running triangles are examples of upward biased corrective structures in an uptrend. In case of Running flat or Irregular flat, the wave B highs are formed above the wave A highs and the wave C lows form above the wave A lows. I belive we are in one of these two upward-biased corrective formations and below are the e-wave counts of what i think is about to transpire over the next few years.
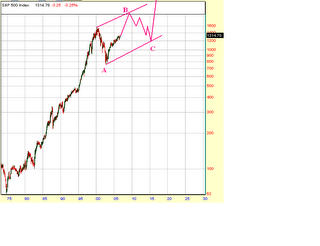
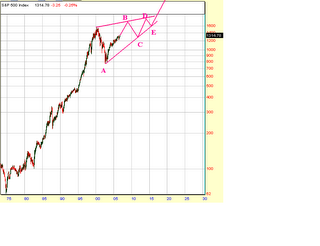
Now why do i think that the market is forming one of these upward biased corrections as opposed to downwards biased corrections(like a zig-zag or a regular flat) ? The reason is the message sent by the markets itself at this point. Think about it. DOW is just 200 points below the all time highs. One big day could put us into ATH and crush the secular bear market argument. Now will the bears concede defeat if DOW makes ATH ? Bookmark this - DOW ATH will only make the bears more bearish. If DOW ATH were to occur, then the argument will shift to the massive inter-market divergences between the DOW, S&P and the Nasdaq. So the bears will start arguing that Nasdaq and S&P made their secular tops in 2000, but DOW is making it's secular top in 2006. In other words, the bearish sentiment will rise to all time highs, with the all time highs in DOW. Bottomline is as the market advances from here, the sentiment which is already extremely bearish will only start getting even worse. Bears have been arguing that Fed has painted itself into a corner. In reality, it's the bears who have painted themselves into a corner here, if the DOW were to make ATH. They can neither remain bearish nor can they turn bullish. The real capitulation would only come later with ATHs in SPX.
Putting the sentiment argument aside, let's look at the structure of the market from 2003 lows. Clearly we are in the middle of a massive upsloping channel from the 2004 highs.
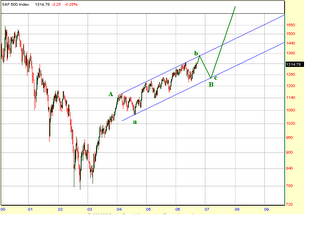
This is not a wedge, as it does not satisfy any of the ending diagonal requirements in term of structure and internal wave relationships. As the structure has been maturing from 2004, it is getting more and more clear that it's a large irregular flat from 2004. The upsloping nature of the correction itself attests to the upward bias of the markets. Once the upper trendline from 2004 gets taken out, then we could safely say that a wave C of B (of a primary degree has begun). As for intermediate term, i belive that we have not yet seen the 4-year cycle lows. Based on the current wave structure, we could see a move to SPX 1270-1280 by early November and then a quick selloff to around SPX 1240 to fill all the gaps that we have left below, since this IT advance begun in July. The most widely watched 4-year cycle bottom in the history could be in March-April 2007, instead of Oct-Nov 2006 as is being widely anticipated today, based on the current wave structure and time relationship. And the 4-year lows will most likely hold above the 2006 lows.
Cyclically speaking, the extreme right translation of this 4-year cycle also attests to the upward bias of the market and any upcoming 4-year cycle low will be a non-event. The next 4-year upcycle should take out the 2000 top on SPX, based on what the current wave structure is implying.
Last but not the least, the all time highs on the NYSE A/D line is also screaming that this advance is far from over.
Once those 4-year lows are behind us, we should begin a persistant market advance from 2007 in a wave C upmove. Wave C should take us to about SPX 1620 (if wave A = wave C) or about SPX 1860 (if wave C = 1.618 * wave A), before this BULL market tops out, most likely by late 2008 to early 2009. By then, most of the bearish caucus will have worn out/capitulated leading the way for a primary degree wave C decline.
Remember the market could also take the form of a running triangle.
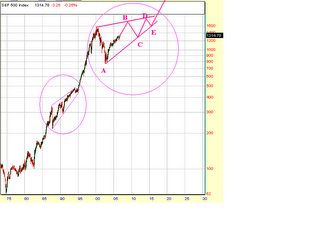
If that happens, it could end up as the bear trap of the millenium, giving no exit for the bears, other than to capitulate en masse. If this scenario were to transpire, then the market volaitlity will start shrinking as we advance into the apex of the triangle, making the market a trader's nightmare. This is what happened from post 1987 crash to 1995 (wave 4), when the market grinded sideways to up slowly and spurted up in a sharp wave 5 move into 2000. This time may not be different, except that its happening at a higher degree !
Here's my big picture e-wave count. I will reserve the detailed explanation and reasons behind this e-wave count for another article.
To see an enlarged version of the charts below, please click on it
IMO the current bull market has a couple of more years of run-up left, before any large correction kicks in. I beleive that we are in a Cycle degree wave 4 correction. The last Cycle degree correction (Cycle degree wave 2) lasted for 16 years between 1966-1982. Since i beleive this to be a Cycle degree wave 4 correction, if this correction should take the same time as wave 2, then it should end somewhere around 2016. Although i agree with the bears that this correction will end somewhere around 2014-2016, i part ways with them when it comes to how that correction is going to unfold and where that bear market bottom is likely to form.
There are three schools of bearish thoughts today.
1) Secular bear market
2) Mutli cyclical bear market
3) Cyclical bear market
Secular bear market
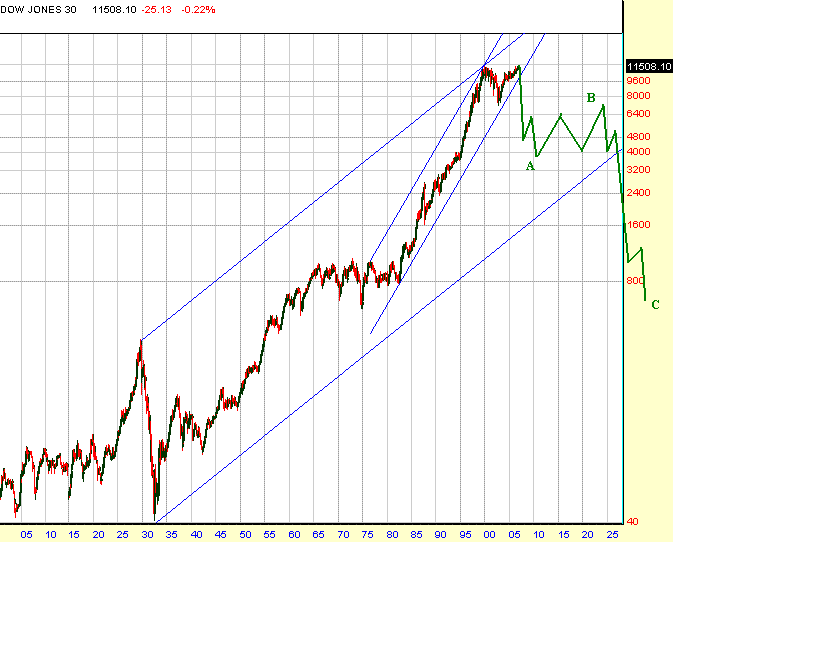
The first school "Secular bear market" folks are armageddonists, who beleive a Grand super cycle degree top has formed in 2000 and we should eventually break below the secular lows of 1982 at DOW 769. This school comprises primarily of deflationary depressionists. Even before we start talking about a secular bear market, we should at least break below the Oct 2002 lows. Until then this school of thought is an arena of TA fantasy and/or delusion.
Multi-cyclical bear market

The second school of thought beleives that we are in a secular bear market, yet they can't take the leap of faith a la Prechter to call for market lows below the prior secular bottom at 1982. It's kind of oxymoronic to call we are in a secular bear within the context of a secular bull, without calling for price lows below the prior secular lows of 1982. Although the term "Secular" is loosely bandied about by this scool, they are in fact calling for a multi-cyclical bear market. Obviously this school defines the secular bear in terms of time, by being non-commital on price. This school has a combination of deflationists, hyperinflationists and kondraitief theorists.
Cyclical bear within a Secular bull
The third school (includes me) believes that we in a secular bull market, but a cyclical bear is unfolding in the context of a secular bull. The very fact that the S&P 500 suffered a 50% correction, the largest correction since the advance begun in 1982, means that the secular bull from 1982 has ended. A secular bull ending does not put us automatically in a secular bear. The end of the secular advance has given birth to a cyclical bear, once complete, should start another secular advance.
What's happening now ?
Bears argue that the bear market did not end in 2002. Two main reasons often cited are that we did not see the capitulation in terms of sentiment compared to the prior bear market lows. The P/E did not revert to the historic mean or to the levels seen in prior bear market bottoms.
But one has to remember that cycle degree corrections are rarely simple A-B-C type corrections. Bull market often begin with as few folks on its back as possible. We live in an information age and every average bear out there knows that you buy stocks for long term when there's blood on the streets. Every average bear knows that the time to invest for the long term is when the P/E reverts back to single digits, like it did in 1982. Every average bear knows that a wave C will follow a wave A. In other words, there's an army of wannabe Warren Buffets waiting for the blood on streets to buy this market with both the hands. As the market keeps advancing relentlessly, as it has been since the 2002 lows, the bearish emotion and bearish frustration keeps rising. The thinking among the bears predominantly today is "I am smart and will wait in cash. Let the lemmings be led. When the bulls lose their shirts and the P/E revert to the bear market bottom levels, i will buy cheap". Will the market accomodate this army of bears waiting to buy cheap or shorting this market recklessly ? If history is any guide, these folks will capitulate big time, right near the market top. Market has its own devious ways of keeping most folks out the market.
Bull markets do not begin when the economy is in a state of utopia. It needs that constant wall of worry, to keep the majority from participating. I think the housing market decline over the next few years from the mania top of 2005 will provide fresh fodder for the bears to worry and the wall of worry for the bull market to climb. In my opinion, the housing and the deteriorating economic fundamentals going forward will be the hook which will keep the majority from participating in the bull market going forward.
The best way to predict the stock market IMO is to look at the stock market itself. You can't predict the stock market by looking at Bonds, Dollar, Gold or even the Economy for that matter. Although correlations exist between these markets, those are not static correlations, but one which changes over time. What was the stock market saying in 2002 Oct ?. Well, it was a screaming bear market. Being bearish then was the right thing to do. Bears extrapolated the market decline into the end of civilization. The market demise was predicted with rational certainity using various TA methodologies, but all arriving at the same conclusion and the same dates for dark ages. All archived discussions at longwaves.net should be an eye opener for all the new bear cubs that are being born today. What went wrong with these folks ?. ("These folks" include me as well - i was a raging bear then !). Kondraiteif winter, a wave 3 of 3 down, currency collapase, a depression that would put 1929 to shame, credit implosion, housing bust, breadlines et al ? I think the problem lies in trying to predict one unknown variable with another unknown - The two variables being economy and the stock market.
Where are we now ?
The monthly trend turned up in the stock market in the fall of 2003 and since then we have been in a bull market. I went back and searched as to what happened when the monthly trend turned up after a crash or a major selloff. I have shown five examples here - 1929 DOW crash, 1987 DOW crash, 2000 S&P meltdown, 2004 BSE (Bombay stock exchange) crash.


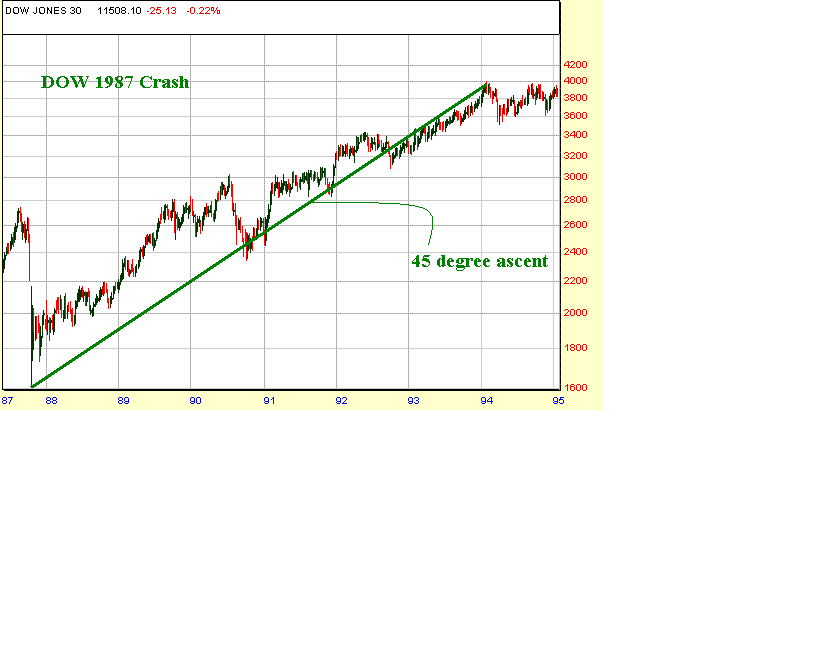
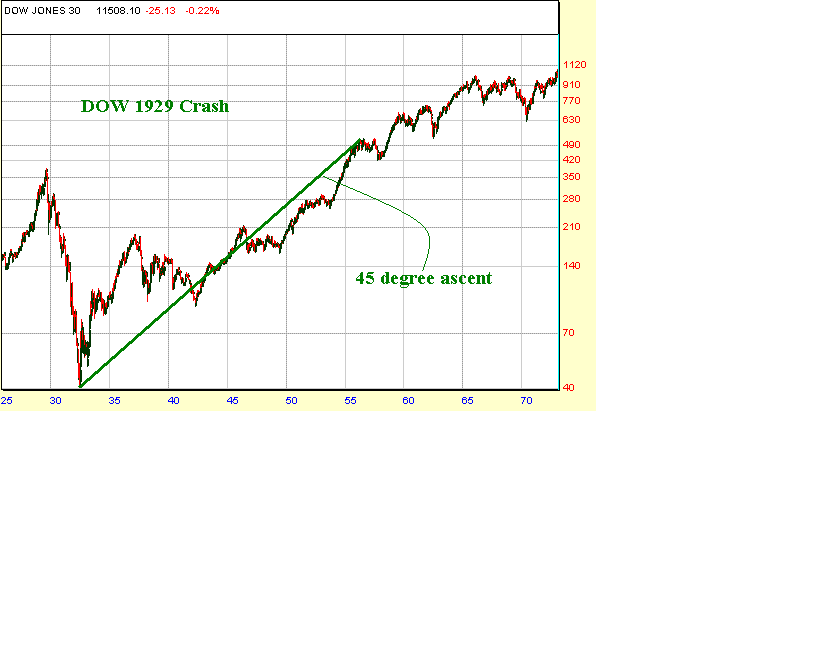
They all exhibit the same characteristic. Once the monthly trend turns up from a "crash bottom", they start a 45 degree ascent, slowly grinding sideways to up, keepping the bears hopes alive. The momentum divergences on the monthly charts keep the bulls from not talking any long term bets. The 45 degree ascent also is a psychological barrier for making long term bets as it looks ugly on the charts. The e-wavers keep calling it a corrective advance until new recovery highs are made. The memories of the prior meltdown also makes it difficult to make long term bets. Essentially the majority shys away from making long term bets, which results in a choppy sideways-to-up grinding markets without a sustained trend on the daily charts. However the trend is clear and visible on the monthly charts. This market profile/structure and the associated psychology makes sure that the majority is out of the bull market and market keeps climbing the constant wall of worry without creating euphoria quicky.
The slow sideways advance also helps to correct the P/E ratio downwards. As we have seen the S&P has advanced nearly 550 points from the 2002 lows, while the P/E has been declining. Now as long as the stock market keeps advancing at a slower rate than the earnings growth, we could end up seeing a P/E in the low teens or even single digits, at all time highs on the SPX. Imagine the horror among those waiting to buy this market at low P/Es, when forced to buy at ATH on SPX. Of course, i am just extrapolating what has happened from 2002 lows going forward, which may or may not happen - but is not something beyond the realm of possibility, given what has happened so far !
Now how can a corrective structure/advance take out the prior market highs ?
Under e-wave, we have upward biased corrective structures and downward biased corrective structures. Flats and Zig-zags are downward biased corrective structures in an uptrend. What most bears are expecting today is a regular flat or zig-zag taking us below Oct 02 lows.

Running Flat (or a irregular flat ) and Running triangles are examples of upward biased corrective structures in an uptrend. In case of Running flat or Irregular flat, the wave B highs are formed above the wave A highs and the wave C lows form above the wave A lows. I belive we are in one of these two upward-biased corrective formations and below are the e-wave counts of what i think is about to transpire over the next few years.

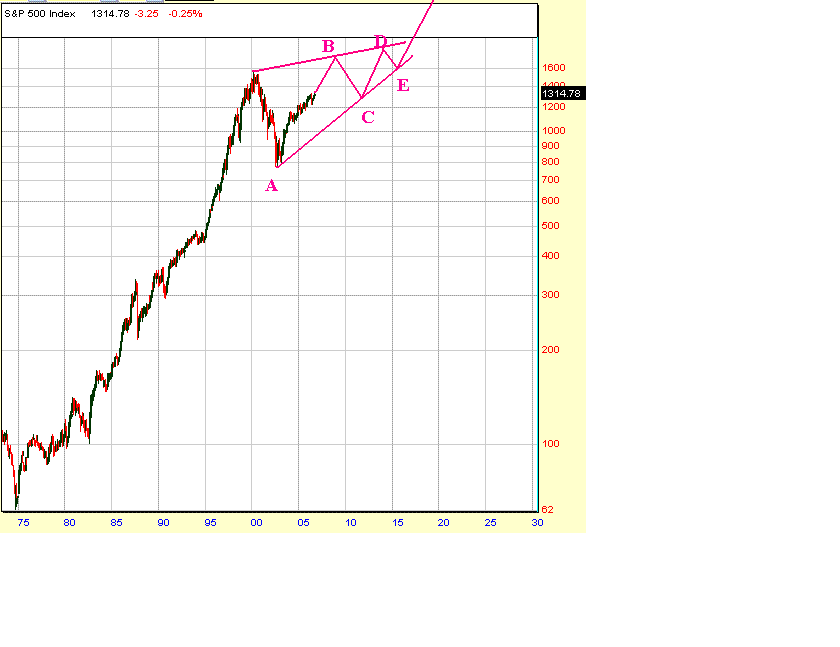
Now why do i think that the market is forming one of these upward biased corrections as opposed to downwards biased corrections(like a zig-zag or a regular flat) ? The reason is the message sent by the markets itself at this point. Think about it. DOW is just 200 points below the all time highs. One big day could put us into ATH and crush the secular bear market argument. Now will the bears concede defeat if DOW makes ATH ? Bookmark this - DOW ATH will only make the bears more bearish. If DOW ATH were to occur, then the argument will shift to the massive inter-market divergences between the DOW, S&P and the Nasdaq. So the bears will start arguing that Nasdaq and S&P made their secular tops in 2000, but DOW is making it's secular top in 2006. In other words, the bearish sentiment will rise to all time highs, with the all time highs in DOW. Bottomline is as the market advances from here, the sentiment which is already extremely bearish will only start getting even worse. Bears have been arguing that Fed has painted itself into a corner. In reality, it's the bears who have painted themselves into a corner here, if the DOW were to make ATH. They can neither remain bearish nor can they turn bullish. The real capitulation would only come later with ATHs in SPX.
Putting the sentiment argument aside, let's look at the structure of the market from 2003 lows. Clearly we are in the middle of a massive upsloping channel from the 2004 highs.
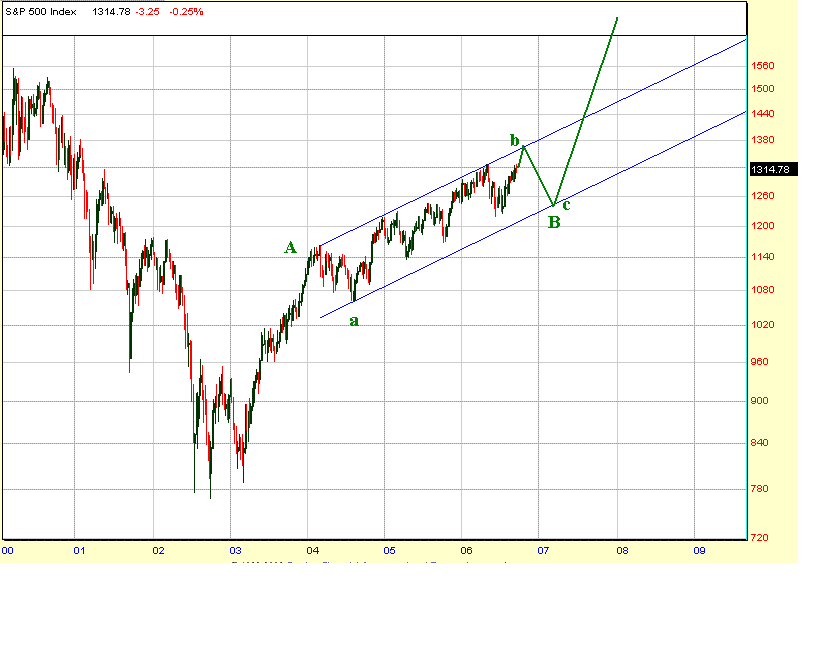
This is not a wedge, as it does not satisfy any of the ending diagonal requirements in term of structure and internal wave relationships. As the structure has been maturing from 2004, it is getting more and more clear that it's a large irregular flat from 2004. The upsloping nature of the correction itself attests to the upward bias of the markets. Once the upper trendline from 2004 gets taken out, then we could safely say that a wave C of B (of a primary degree has begun). As for intermediate term, i belive that we have not yet seen the 4-year cycle lows. Based on the current wave structure, we could see a move to SPX 1270-1280 by early November and then a quick selloff to around SPX 1240 to fill all the gaps that we have left below, since this IT advance begun in July. The most widely watched 4-year cycle bottom in the history could be in March-April 2007, instead of Oct-Nov 2006 as is being widely anticipated today, based on the current wave structure and time relationship. And the 4-year lows will most likely hold above the 2006 lows.
Cyclically speaking, the extreme right translation of this 4-year cycle also attests to the upward bias of the market and any upcoming 4-year cycle low will be a non-event. The next 4-year upcycle should take out the 2000 top on SPX, based on what the current wave structure is implying.
Last but not the least, the all time highs on the NYSE A/D line is also screaming that this advance is far from over.
Once those 4-year lows are behind us, we should begin a persistant market advance from 2007 in a wave C upmove. Wave C should take us to about SPX 1620 (if wave A = wave C) or about SPX 1860 (if wave C = 1.618 * wave A), before this BULL market tops out, most likely by late 2008 to early 2009. By then, most of the bearish caucus will have worn out/capitulated leading the way for a primary degree wave C decline.
Remember the market could also take the form of a running triangle.
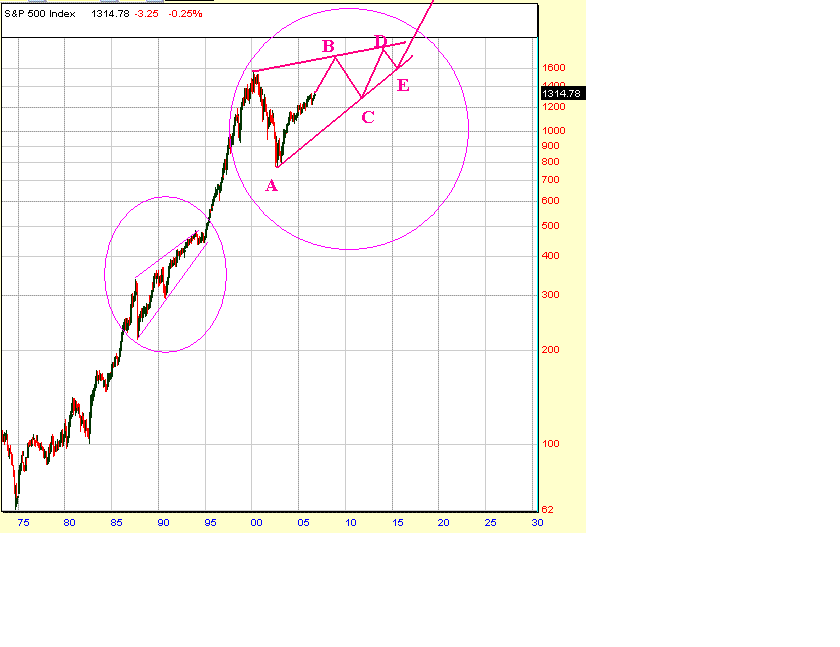
If that happens, it could end up as the bear trap of the millenium, giving no exit for the bears, other than to capitulate en masse. If this scenario were to transpire, then the market volaitlity will start shrinking as we advance into the apex of the triangle, making the market a trader's nightmare. This is what happened from post 1987 crash to 1995 (wave 4), when the market grinded sideways to up slowly and spurted up in a sharp wave 5 move into 2000. This time may not be different, except that its happening at a higher degree !
Wednesday, June 07, 2006
Inorderly market

Daily Momentum - Sell, Daily Trend - Sell
Weekly Momentum - Sell, Weekly trend - Neutral
Monthly Momentum - Sell, Monthly trend - Up
At this juncture, it's hard to predict what would happen next. One can only observe the market on a day to day basis and look for clues. One thing is for sure - the trend is down. That does not make trading easier, as one has to negotiate with the violent snapback rallies.
Technically the market is in a setup for a nasty decline. The key remains whether the 1245 lows on SPX holds or not. If it holds, we could see a sharp 40-50 points rally. That seems very unlikely at this juncture. On the other hand, a voilent decline looks more probable. Once we break 1245, it would confirm that wave C is in progress, which would target a minimum of SPX 1200. There's simply no support until then. The reason i think that a sharp decline is possible here is based on the internals. Look at the coast-coast movement on the NYSE MCO. The MCO moved from -70 level to +50 level, which was a pretty broad based rally, which sucked in a lot of money into markets hoping that the worst is over or the "V" shaped bottom was in. Now the same MCO has encountered a failure and is now back below the zero level. This has now turned the summation index back down, but this time it's turning down while it's below the zero line !. That's what i call a setup for nastiness. Now the same money which entered the markets pushing the MCO to 50 is panicking and leaving the markets. Once the stops below 1245 are triggered, it could blossom into a climax.
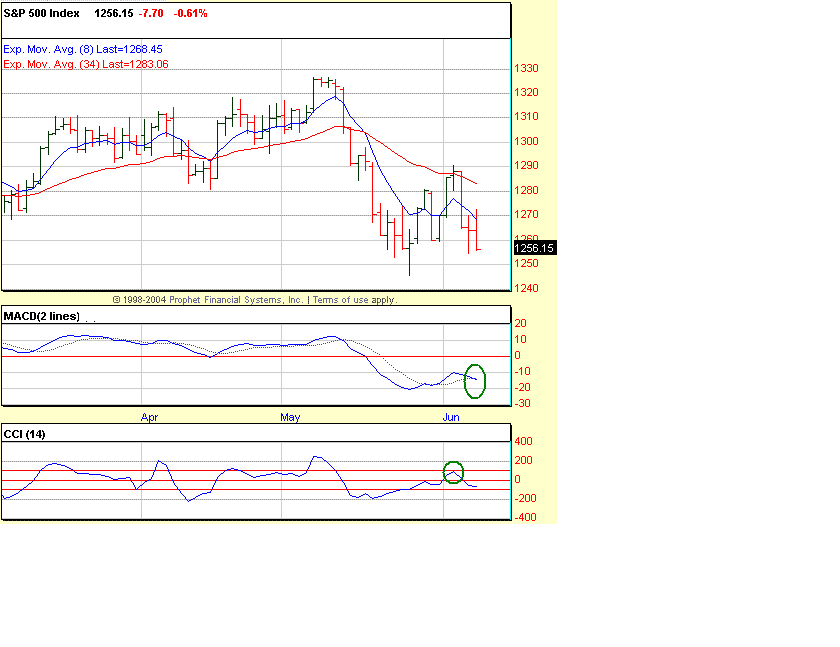
Also notice in the above chart, both the CCI and the MACD are issuing secondary sell signals. Again the MACD is issuing the secondary sell below the zero line. Which is why we are seeing that severe weakness in the marketplace. I had a 120-min buy signal yesterday which is typically good for 20-30 SPX points in a orderly market. All we got today from that signal was a mere 12 points and it abruptly turned down and erased all the gains in one single 120-min bar. That says a lot about the weakness in the markets. This is not the average joe-sixpack panicking here. It's the big boys panicking here. Cash smells good! Capital preservation is the key in these times.
I will try to post my hourly swing buy and sell signals here as the daily will continue to be on a sell for quite sometime.
Monday, May 15, 2006
Running correction

Here's my e-wave count. Below 1280, this count is wrong and is bearish intermediate term. Otherwise, we should start a 2 months+ relentless advance in the SPX. I will be going out on a vacation for the next 2 weeks and this will be my last post until i come back.
Good trading all !
Thursday, May 11, 2006
Perspective is everthing !
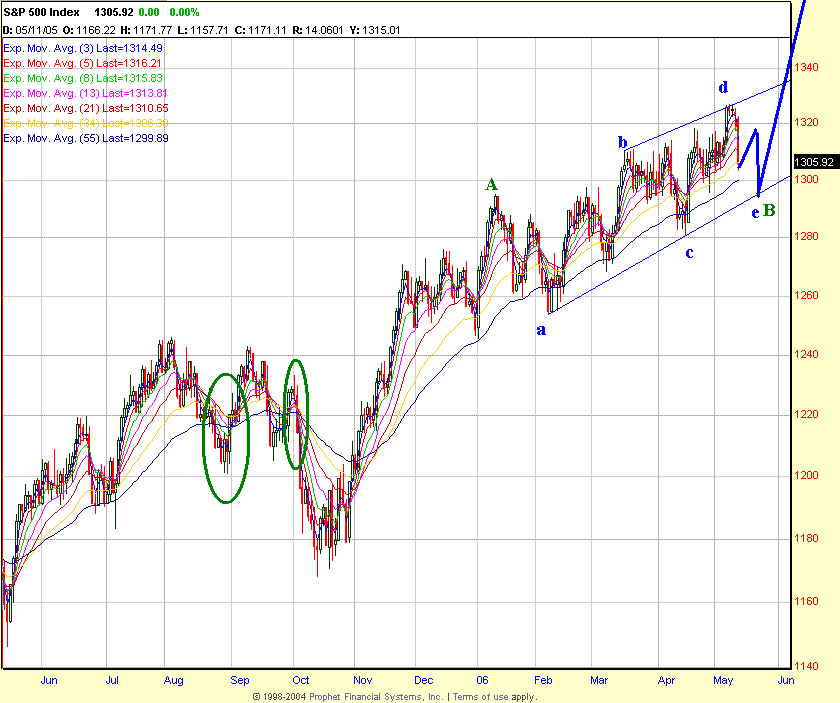
This is as trendless a market i have traded in years. Here's the reason. The market is forming a running triangle, confusing the heck out of everyone. Every daily buy signal lasts two days. Every daily sell signal lasts for two days. But that's the function of the market pattern we are in. I will perhaps have my buy signal fail here, very likely. (a break of 1295.56 swing low will cause my buy signal to fail). This will be the second consecutive signal failure this year after 8 consecutive signal successes.
Perspective is everthing. There's already crash talk on the message boards after a day of decline. Just take a loook at the above chart and see if it's bullish or bearish. By no known measures of trend and momentum analysis can the above market structure be construed as bearish. The market entered the zone of vulnerability only twice over the last year, both happened in the fall of 05, which i have circled in green. Look how the EMA ribbons curled over and crossed the blue line. That's the point of maximum concern for longs. That's the zone where mini-crashes can happen. I have checked back in the history for the last 100 years and no crash/mini-crash has come out of the blue before those darn ribbons curled and crossed over. And of course there are certain momentum signatures before those mini-crashes happen.
If my e-wave count is right we should see a bounce tommorow followed by a failure and retest of the SPX 1290-1296 region and a sharp rally following that. The Nasdaq MCO is forming a positively diverging bottom w.r.t price as long as the April lows on the MCO hold. The NYSE cumulative A/D is still in a bullish configuration. What would turn me bearish here ? - A break of SPX 1280, which would turn the intermediate term down. So until proven otherwise, i am looking for a buying opportunity again.
Monday, May 08, 2006
SPX buy signal at Friday's close
On May 4, i wrote
The NYSE MCO has moved above the zero line. Now if we see a good breadth thrust day, that would create a zero-line rejection on the summation index and would be a good intermediate term buy signal.
That's precisely what happened. We got a good breadth thrust day on friday. The summation index had a zeroline rejection. I think the indecision of the markets is behind us and i would consider this as an intermediate term buy signal.
The NYSE MCO has moved above the zero line. Now if we see a good breadth thrust day, that would create a zero-line rejection on the summation index and would be a good intermediate term buy signal.
That's precisely what happened. We got a good breadth thrust day on friday. The summation index had a zeroline rejection. I think the indecision of the markets is behind us and i would consider this as an intermediate term buy signal.
Thursday, May 04, 2006
Don't fight if the market turns up here
VST, my view has not changed that we get a move here to about SPX 1290. But the resilence of this market has been frustrating to short or hold any shorts here. Here's some comparison between 2003 and 2006 purely from momentum and internals perspective. Will history repeat itself ? Time will tell....
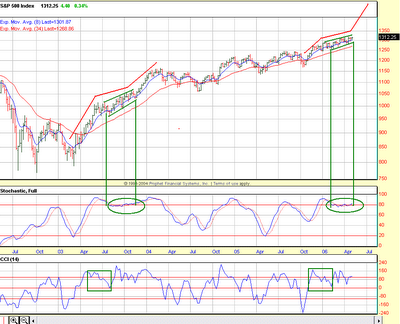
The fractal we are witnessing from Oct 05 is an exact mimic of the A-B-C Fractal that we witnessed from March 03 - Jan 04. July 03 thru Oct 03, we were in this running triangle and then broke out of it and melted-up.
We see the same running trianlge here from Feb 06, which is about to finish and switch into a terminal move. My custom Full Stochastic has the exact same signature, flatlining about the 80 line and turning up. Remember overbought weekly indicators turn down. They rarely don't. On those rare instances when they don't turn down and instead turn up, price goes parabolic. That's what we are seeing on the Full Stoch.The CCI has the exact similar signature prior to the beginning of the running triangle and then showing hesitation (i.e chopping around the 100 line) before the big move. Price action then was around the 8 EMA, which is the case now. Similarities are just uncanny.
Sentiment-wise, there was this tremendous disbeleif then, like we have today. Folks were expecting a 9-month cycle bottom then. Now the talk is all centered around the 20-week bottom. Every messageboard i visit, i see this talk about the 20-week cycle bottom. Then in 2003, the internals bottomed during the 9 month cycle bottom while the price made a higher bottom. We are seeing the same again. The summation index is making it's trip to the zero line, i.e the internals are bottoming while the price keeps moving higher.
The NYSE MCO has moved above the zero line. Now if we see a good breadth thrust day, that would create a zero-line rejection on the summation index and would be a good intermediate term buy signal. For now, waiting and watching for the resolution...

The fractal we are witnessing from Oct 05 is an exact mimic of the A-B-C Fractal that we witnessed from March 03 - Jan 04. July 03 thru Oct 03, we were in this running triangle and then broke out of it and melted-up.
We see the same running trianlge here from Feb 06, which is about to finish and switch into a terminal move. My custom Full Stochastic has the exact same signature, flatlining about the 80 line and turning up. Remember overbought weekly indicators turn down. They rarely don't. On those rare instances when they don't turn down and instead turn up, price goes parabolic. That's what we are seeing on the Full Stoch.The CCI has the exact similar signature prior to the beginning of the running triangle and then showing hesitation (i.e chopping around the 100 line) before the big move. Price action then was around the 8 EMA, which is the case now. Similarities are just uncanny.
Sentiment-wise, there was this tremendous disbeleif then, like we have today. Folks were expecting a 9-month cycle bottom then. Now the talk is all centered around the 20-week bottom. Every messageboard i visit, i see this talk about the 20-week cycle bottom. Then in 2003, the internals bottomed during the 9 month cycle bottom while the price made a higher bottom. We are seeing the same again. The summation index is making it's trip to the zero line, i.e the internals are bottoming while the price keeps moving higher.
The NYSE MCO has moved above the zero line. Now if we see a good breadth thrust day, that would create a zero-line rejection on the summation index and would be a good intermediate term buy signal. For now, waiting and watching for the resolution...
Tuesday, May 02, 2006
Get ready for a fast move down !
My expectation over the last few days has been for a move up to SPX 1320 cash and then a move to 1290. The reason i expect 1320-23 is because that's where the weekly resistance bands passes. Generally markets love to kiss those bands before they make a big move. Given all the hesitation and the overlapping action over the last few days, my best guess is that the uncertainity will resolve down towards the 1290 area. The NYSE summation index would also have completed a trip to the zero line by then.
Markets can always throw a curve ball. If for any reason we get a daily close above SPX 1320 then this scenario is wrong and i will have to turn neutral and reasses the situation. Will the market hit the 1320 resistance band ?. I am not completely certain. There's always a possibility of a failure below that level. This is one heck of a nervous market, until the Fed meeting is done with. Bottomline, any sell on 30-min tommorow will get me aggresively short.
Markets can always throw a curve ball. If for any reason we get a daily close above SPX 1320 then this scenario is wrong and i will have to turn neutral and reasses the situation. Will the market hit the 1320 resistance band ?. I am not completely certain. There's always a possibility of a failure below that level. This is one heck of a nervous market, until the Fed meeting is done with. Bottomline, any sell on 30-min tommorow will get me aggresively short.
Monday, May 01, 2006


Sunday, April 30, 2006
Not ready to break out yet
My best take on the market at this moment is that the overall structure remains constructive for a bullish case. But the ingredients from a momentum perspective and from the internals configuration doesn't allow for a breakout just yet !. In the VST (over the next couple of days) we could see NQ test the 1740 area and the SPX cash test the 1320 area followed by a failure. The failure should retest the SPX 1290 area which is now a solid support.
My expectation is largely based on the momentum and EMA configuration that i am seeing on the SPX daily charts. From the internals perspective, the markets have been rallying in the face of the NYSE summation index drifting lower. This means the money is leaving the markets without causing much price damage, which is not necessarily bearish relative to the overall strength of the weekly cumulative A/D line itself. LOL, i was right about the summation index making a trip to the zero line. I thought that would have been accompanied with severe price damage. Boy, was i wrong ! This market seems stronger than i thought. Now once the zero line trip is complete, by which time we should see a minor price damaage, which i mentioned earlier i.e a trip to 1290 on the SPX.
Now the million dollar question in my opinion begins after that ? Will the summation index turn up from the zero line ? If it does, imagine what would happen to the sideline money, the bears etc ? I think that would create some serious upside pressure. I guess it's not clear at this point whether we cross thru the zero line or have a rejection at the zero line. So it's putting the cart in front of the horse. We will deal with it when we get there.
For now, my expectation is a a VST move higher to about SPX cash 1320 and a failure, a retest of 1290 and then.....
My expectation is largely based on the momentum and EMA configuration that i am seeing on the SPX daily charts. From the internals perspective, the markets have been rallying in the face of the NYSE summation index drifting lower. This means the money is leaving the markets without causing much price damage, which is not necessarily bearish relative to the overall strength of the weekly cumulative A/D line itself. LOL, i was right about the summation index making a trip to the zero line. I thought that would have been accompanied with severe price damage. Boy, was i wrong ! This market seems stronger than i thought. Now once the zero line trip is complete, by which time we should see a minor price damaage, which i mentioned earlier i.e a trip to 1290 on the SPX.
Now the million dollar question in my opinion begins after that ? Will the summation index turn up from the zero line ? If it does, imagine what would happen to the sideline money, the bears etc ? I think that would create some serious upside pressure. I guess it's not clear at this point whether we cross thru the zero line or have a rejection at the zero line. So it's putting the cart in front of the horse. We will deal with it when we get there.
For now, my expectation is a a VST move higher to about SPX cash 1320 and a failure, a retest of 1290 and then.....
Thursday, April 27, 2006
Crummy market !
I think this market has been as crummy as i have seen in a while with no conviction to move either way.
Anyway with all the excitement that we saw today, my system never went to a buy. NDX remains on a daily sell. SPX which has been relatively stronger than NDX, which was close to making new highs coudn't generate a buy signal. Worse among the lot, DOW made new highs today and still remains on a daily momentum sell (I think this is as crazy as it gets). NQ might double top around 1752 area. But that's about it for that sucker. I don't think NDX will make new swing highs in this swing. Call me a skeptic. The odds favour some downside fireworks starting anytime here. The bottom pickers got their azz saved today - thanks to Fed obesssed programs !. All the technicals i watch, says down. If the markets trumps all those technicals, i won't fight it, but won't be obsessed with it either.
Anyway with all the excitement that we saw today, my system never went to a buy. NDX remains on a daily sell. SPX which has been relatively stronger than NDX, which was close to making new highs coudn't generate a buy signal. Worse among the lot, DOW made new highs today and still remains on a daily momentum sell (I think this is as crazy as it gets). NQ might double top around 1752 area. But that's about it for that sucker. I don't think NDX will make new swing highs in this swing. Call me a skeptic. The odds favour some downside fireworks starting anytime here. The bottom pickers got their azz saved today - thanks to Fed obesssed programs !. All the technicals i watch, says down. If the markets trumps all those technicals, i won't fight it, but won't be obsessed with it either.
Monday, April 24, 2006
SPX sell signal at close today
As you might recall, i posted this a couple of days back.
Now if the DOW starts correcting here, it would push the SPX CCI below 100 and NDX will seem like a rejection from the 100 line. So the implication is that some sort of a short term correction will begin soon. If this scenario were to transpire, it won't be a plain garden variety ST correction. The reason being the daily MACD is already hovering near zero and if we were to get a continuation sell on the MACD, the MACD would dip below the zero line. Selloffs when the MACD is below the zero line are generally brutal.
The post market action seems to confirm my above anaysis.
My system issued a daily sell signal on SPX at close today. I am expecting a sharp selloff over the next few days. The NYSE MCO had a zero line reject today. This market has been pushing against internal divergences. The sentiment seems to be one of "Divergences don't matter anymore". I think the market is about to give a surprise to the bulls here.
Just one look at this tells all
http://stockcharts.com/gallery/?$NYAD
Good trading to all !
Now if the DOW starts correcting here, it would push the SPX CCI below 100 and NDX will seem like a rejection from the 100 line. So the implication is that some sort of a short term correction will begin soon. If this scenario were to transpire, it won't be a plain garden variety ST correction. The reason being the daily MACD is already hovering near zero and if we were to get a continuation sell on the MACD, the MACD would dip below the zero line. Selloffs when the MACD is below the zero line are generally brutal.
The post market action seems to confirm my above anaysis.
My system issued a daily sell signal on SPX at close today. I am expecting a sharp selloff over the next few days. The NYSE MCO had a zero line reject today. This market has been pushing against internal divergences. The sentiment seems to be one of "Divergences don't matter anymore". I think the market is about to give a surprise to the bulls here.
Just one look at this tells all
http://stockcharts.com/gallery/?$NYAD
Good trading to all !
Thursday, April 20, 2006
Why i am not too excited about the upside here ?
Some simple intermarket analysis. Daily CCI(14) on DOW is around 199, SPX is 129 and NDX is around 90.
DOW is already at extremes which implies some sort of correction to kick in on the DOW. Now if the NDX and SPX starts moving higher along with the DOW, DOW CCI would reach very extreme territory and will end up as a blowoff move. Not very exciting if one is positioning for a swing move on the long side, cuz the reversals from the blowoffs could be swift. Look at what happened to GOLD and SILVER today !
Now if the DOW starts correcting here, it would push the SPX CCI below 100 and NDX will seem like a rejection from the 100 line. So the implication is that some sort of a short term correction will begin soon. If this scenario were to transpire, it won't be a plain garden variety ST correction. The reason being the daily MACD is already hovering near zero and if we were to get a continuation sell on the MACD, the MACD would dip below the zero line. Selloffs when the MACD is below the zero line are generally brutal.
So my strategy at this point would be to daytrade the hourly until either one of the scenario transpires and then take a swing short position once my system issues a sell.
DOW is already at extremes which implies some sort of correction to kick in on the DOW. Now if the NDX and SPX starts moving higher along with the DOW, DOW CCI would reach very extreme territory and will end up as a blowoff move. Not very exciting if one is positioning for a swing move on the long side, cuz the reversals from the blowoffs could be swift. Look at what happened to GOLD and SILVER today !
Now if the DOW starts correcting here, it would push the SPX CCI below 100 and NDX will seem like a rejection from the 100 line. So the implication is that some sort of a short term correction will begin soon. If this scenario were to transpire, it won't be a plain garden variety ST correction. The reason being the daily MACD is already hovering near zero and if we were to get a continuation sell on the MACD, the MACD would dip below the zero line. Selloffs when the MACD is below the zero line are generally brutal.
So my strategy at this point would be to daytrade the hourly until either one of the scenario transpires and then take a swing short position once my system issues a sell.
Wednesday, April 19, 2006
Commodity complex on fire !

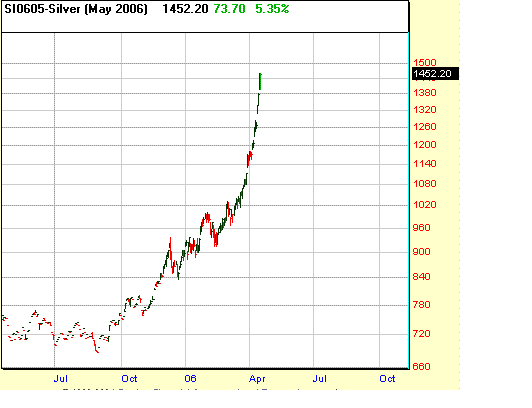

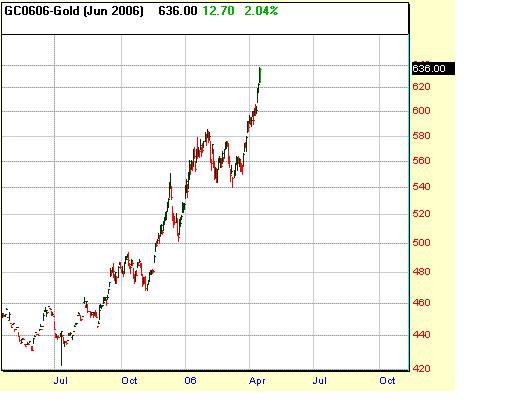

The entire commodity complex and the 10-year yields are on fire. If one thinks that the Fed is done, as portrayed by the media, i think they must be smoking something really heavanly. I think a 50bp hike in May is now becoming more of a reality, if this commodity meltup is to be contained. Now if the stock market were to discount that hike before that actaully happens, then we should see a serious drop in the markets before the Fed meeting. At least, that's the conceptual framework from which i am operating. Now whether that drop comes from higher levels or right from here is not clear at this point. The daily momentum indicators are still on a momentum buy. I am still waiting for a sell signal from my system. Until i get that signal, i will avoid swing trading and continue to trade the hourly charts in both directions. In the VST though, i expect a gap-down tommorow morning and a swift selloff. And then the OPEX circus should continue for the next 2 days. Overall i am bearish now and i expect the NYSE summation index to make a trip to the zero line or undershoot it, while the NYSE MCO puts in a divergent bottom, before any meaningful rally resumes.
Tuesday, April 18, 2006
Extreme to Extreme to Extreme...
This market is simply not playable from a swing trading perspective. The only way to play this market is either daytrade of if one is swing trading, blindly pick the extremes with the hope of getting it right. If one waits for a technical confirmation of any sort, then the move is over by then. To illustrate a case in point, the momentum flipped to a sell on 4/11 and that was the day the daily CCI(20) hit -255. Do you go short then ? I think one would have been obliterated if they played leverage and went went short on that day. That's one of the reasons i turned neutral on that day. Every momentum buy on my indicators is not a buy signal or every momentum sell is not a sell signal on my system. I have rules to determine what is a valid buy/sell signal.
As i said on April 11 on this blog
In any case, this is the land of quick or dead. Long and shorts are equally dangerous. With this kind of CCI configuration, we could easily see a 20 point short squeeze or a 30-40 drop kind of moves in a day.
While in hindsight, it always looks easy and one could say, "i could have gone long yesterday with tight stops and caught this move". The cycle folks have been expecting this 5 week bottom since the last week. So one could have gone long a few times in the last week and got stopped out multiple time, unless one does not use stops. Two of my indicators flipped to long today, while one more indicator did not. In other words, i still don't have a buy signal despite the obsence move today. By the time i get confirmation, this move could be over.
The daily CCI has moved from +226 (Extreme) on 3/16 to -255 (Super Extreme) on 4/11 on now is gunning for another extreme, perhaps. If this market corrects back and puts in a constructive bottom, that would be the time to go long for a swing trading long. On the other hand if we blowoff here and put another CCI extreme, that would be a constructive top to go short from. Right now we are technically still in the land of "Quick or dead". So my system remains neutral with no signal at this point as we are stuck in this zone of high risk.
The reason for the market rally as the media potrayed was the FED minutes which hinted at the rate hike campaign nearing an end. That's pure garbage. The economy is operating at full capacity at full employment levels and the liquidty is still sloshing around the globe at unprecedented levels. When the FED met the last time GOLD was not at 620 nor was silver or copper or OIL, which are all at crazy heights. The commodity markets are just going nuts. The situation has clearly changed, dramatically so from the last Fed meeting. So to assign any value to the last FED meeting minutes is meaningless. The FED rate hike campaign has been eerily simlar to 1999-2000. After a series of 25 bp hikes from 1999 to March 2000 Fed meeting, we got that 50 basis points hike in May 2000. My feeling is history is about to repeat itself and we could see a 50 basis points in the May 2006 Fed meeting, which i think now becomes necessary, if the Fed were to contain the commodity markets melt-up here. Time will tell.
So will i lie by the poolside and sip Pina Coladas while i don't have a signal ? Heck no. I will continue to daytrade this market in the directional of the hourly trend. When my system issues the next buy or sell signal, i will post on this blog.
As i said on April 11 on this blog
In any case, this is the land of quick or dead. Long and shorts are equally dangerous. With this kind of CCI configuration, we could easily see a 20 point short squeeze or a 30-40 drop kind of moves in a day.
While in hindsight, it always looks easy and one could say, "i could have gone long yesterday with tight stops and caught this move". The cycle folks have been expecting this 5 week bottom since the last week. So one could have gone long a few times in the last week and got stopped out multiple time, unless one does not use stops. Two of my indicators flipped to long today, while one more indicator did not. In other words, i still don't have a buy signal despite the obsence move today. By the time i get confirmation, this move could be over.
The daily CCI has moved from +226 (Extreme) on 3/16 to -255 (Super Extreme) on 4/11 on now is gunning for another extreme, perhaps. If this market corrects back and puts in a constructive bottom, that would be the time to go long for a swing trading long. On the other hand if we blowoff here and put another CCI extreme, that would be a constructive top to go short from. Right now we are technically still in the land of "Quick or dead". So my system remains neutral with no signal at this point as we are stuck in this zone of high risk.
The reason for the market rally as the media potrayed was the FED minutes which hinted at the rate hike campaign nearing an end. That's pure garbage. The economy is operating at full capacity at full employment levels and the liquidty is still sloshing around the globe at unprecedented levels. When the FED met the last time GOLD was not at 620 nor was silver or copper or OIL, which are all at crazy heights. The commodity markets are just going nuts. The situation has clearly changed, dramatically so from the last Fed meeting. So to assign any value to the last FED meeting minutes is meaningless. The FED rate hike campaign has been eerily simlar to 1999-2000. After a series of 25 bp hikes from 1999 to March 2000 Fed meeting, we got that 50 basis points hike in May 2000. My feeling is history is about to repeat itself and we could see a 50 basis points in the May 2006 Fed meeting, which i think now becomes necessary, if the Fed were to contain the commodity markets melt-up here. Time will tell.
So will i lie by the poolside and sip Pina Coladas while i don't have a signal ? Heck no. I will continue to daytrade this market in the directional of the hourly trend. When my system issues the next buy or sell signal, i will post on this blog.
Tuesday, April 11, 2006
Zone of high volatility
As i posted in the morning, after taking out the 1291.84 swing low, my signal from 3/29 ended in a failure, after seven consecutive good signals this year. A buy signal failure does not automatically generate a sell signal, as i have rules as to what constitute a buy/sell signal. So i turn neutral at this point.
The rules from my system aside, the market is now in a zone of Meltup or Crashes. Here's what's fascinating technically at this juncture. The daily CCI(20) went below -250 at the close on SPX. Here are those rare instances in the last 10 years when the CCI went below -250 and when a ST bottom occured.
3/31/97 - Bottom came 3 days later
10/27/97 - Bottom came one day later
8/28/98 - Bottom came 2 days later
5/25/99 - Bottom came 2 days later
4/14/2000 - Bottomed on the same day
10/11/2000 - Bottom came a day later
3/11/2004 - Bottom came 3 days later
4/15/2005 - Bottom came 3 days later
In all of the above instances a ST bottom occured within 1-3 days of CCI closing below -250. In some cases it was a "V" bottom and in some cases the bottoms were retested after a few days of bounce. There's nothing magical as to why this happens every time. If one understands how the CCI is constructed, it's one of the most sensitive momentum indicator out there, as long as it remains between -100 and +100. Once we go above/below +/- 100, the sensitivity drops rapidly. That is a large price movement is required to produce even a small delta on the CCI. Below -250 it becomes almost impossible to push this indicator down anymore. If we were to move from -250 to -300 tommorow, it would require a huge price drop to the tune of 40-50 points on SPX. In other words a mini-crash would be required. And guess what would happen if a mini-crash were to occur, price would snap back like a streched rubber band, cuz it's uncharted territory below -300. So any mini-crash here, if it were to happen, will be all retraced within a matter of hours. Look at April 2000 to get an idea as to what i am talking about or the 1997 mini-crash. If a mega crash like 1987 were to happen, that's a different story. Saying CCI went below -300 and we had a crash in 1987 is totally meaningless without relating to the trend configuration at that given juncture. During 1987, the 8 EMA had crossed below the 34 EMA. The 55 EMA was already sloping down, not to mention the internals then. Today we have a totally different internal configuration and trend configuration. The 8 EMA is still above the 34 EMA. The 55 EMA is still sloping up. The EMA ribbons i am watching are still pointed up to flat. They need to start curling down before we can even start talking about a mini-crash.
There were a few developments today, as far as the internals are concerened, which begs attention. The NYSE MCO took out the March bottom. The 5% and 10% components of the MCO moved belwo the zero line. The NYSE cumulative A/D line went below the 39 EMA. These are negative developments and in the past have led to intermediate term declines. So what this tells me is even if we rally here, a retest will required before a constructive IT bottom falls in place. On other hand if decline sharply without a bounce, then a "V" shape bottoms becomes a high probability event, based on the CCI configuration. In any case, this is the land of quick or dead. Long and shorts are equally dangerous. With this kind of CCI configuration, we could easily see a 20 point short squeeze or a 30-40 drop kind of moves in a day. It's going to be very volatile the next few days as the bottom gets put in place. Think Oct 05 bottom. It's the territory of daytraders the next few days. If we move up tommorow, i will look for a secondary sell signal. If we move down, i will be looking for a buy signal. For now, i am neutral and will daytrade the heck out this market, the next few days. So i patiently wait for the next signal at this point. Until then, good trading...
The rules from my system aside, the market is now in a zone of Meltup or Crashes. Here's what's fascinating technically at this juncture. The daily CCI(20) went below -250 at the close on SPX. Here are those rare instances in the last 10 years when the CCI went below -250 and when a ST bottom occured.
3/31/97 - Bottom came 3 days later
10/27/97 - Bottom came one day later
8/28/98 - Bottom came 2 days later
5/25/99 - Bottom came 2 days later
4/14/2000 - Bottomed on the same day
10/11/2000 - Bottom came a day later
3/11/2004 - Bottom came 3 days later
4/15/2005 - Bottom came 3 days later
In all of the above instances a ST bottom occured within 1-3 days of CCI closing below -250. In some cases it was a "V" bottom and in some cases the bottoms were retested after a few days of bounce. There's nothing magical as to why this happens every time. If one understands how the CCI is constructed, it's one of the most sensitive momentum indicator out there, as long as it remains between -100 and +100. Once we go above/below +/- 100, the sensitivity drops rapidly. That is a large price movement is required to produce even a small delta on the CCI. Below -250 it becomes almost impossible to push this indicator down anymore. If we were to move from -250 to -300 tommorow, it would require a huge price drop to the tune of 40-50 points on SPX. In other words a mini-crash would be required. And guess what would happen if a mini-crash were to occur, price would snap back like a streched rubber band, cuz it's uncharted territory below -300. So any mini-crash here, if it were to happen, will be all retraced within a matter of hours. Look at April 2000 to get an idea as to what i am talking about or the 1997 mini-crash. If a mega crash like 1987 were to happen, that's a different story. Saying CCI went below -300 and we had a crash in 1987 is totally meaningless without relating to the trend configuration at that given juncture. During 1987, the 8 EMA had crossed below the 34 EMA. The 55 EMA was already sloping down, not to mention the internals then. Today we have a totally different internal configuration and trend configuration. The 8 EMA is still above the 34 EMA. The 55 EMA is still sloping up. The EMA ribbons i am watching are still pointed up to flat. They need to start curling down before we can even start talking about a mini-crash.
There were a few developments today, as far as the internals are concerened, which begs attention. The NYSE MCO took out the March bottom. The 5% and 10% components of the MCO moved belwo the zero line. The NYSE cumulative A/D line went below the 39 EMA. These are negative developments and in the past have led to intermediate term declines. So what this tells me is even if we rally here, a retest will required before a constructive IT bottom falls in place. On other hand if decline sharply without a bounce, then a "V" shape bottoms becomes a high probability event, based on the CCI configuration. In any case, this is the land of quick or dead. Long and shorts are equally dangerous. With this kind of CCI configuration, we could easily see a 20 point short squeeze or a 30-40 drop kind of moves in a day. It's going to be very volatile the next few days as the bottom gets put in place. Think Oct 05 bottom. It's the territory of daytraders the next few days. If we move up tommorow, i will look for a secondary sell signal. If we move down, i will be looking for a buy signal. For now, i am neutral and will daytrade the heck out this market, the next few days. So i patiently wait for the next signal at this point. Until then, good trading...
Buy signal from 3/29 fails
SPX buy signal from my system, from 3/29, ended in a failure today, after taking out the 1291.84 (swing low of March 28). This is the first failure out of 8 signals this year. It was very unusual that i had a string of 7 good signals in a row. So it was about time to get a failure, i guess. It's too risky to short here or go long. So i will turn neutral. The next signal could be either a continuation sell or a buy. So we wait....
Sunday, April 09, 2006
Spooked by the 10-year yields
My system remains on a daily and weekly buy signal. We went close to a weekly and daily combo sell signal on Friday, but escaped by a hair's breadth. I think we should bottom early Monday and take off to the upside again to complete this intermediate rally. Based on the current configuration, i am expecting an intermediate term top to form in about 2 weeks
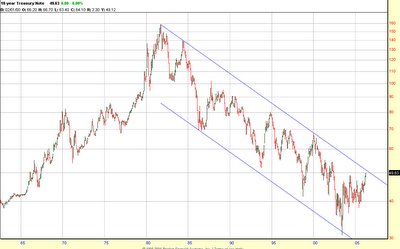
What's spooking the market right now is the 10-year yieds challenging the 25 year old declining tops line. If the 10-year yields break out of the channel shown in the chart, then the technical implication is that a long term trend change has occured in the long end of the curve. Now that does not mean the yields will melt up in the next few months or we will bust thru the channel immediately. Such multi-year resistances are generally not taken out in the first attempt. So we may have to challenge this resitance a few times, before we break out. The bond market vigilantes, if they still exist (LOL) have finally awakened from their deep slumber, it seems.
The global liquidity glut has reached insane proportions. My guess is the Fed would increase the rate by 50 basis points in May, just like they did in May 2000 (when they increased from 6 to 6.5). It could be deja vu all over again. Again that's just my guess, which i beleive will be necessary, if they were to avoid a bond market and dollar carnage here. I think the stocks will continue it's sideways to upward bias until this ocean of liquidty is worked off, which will take a while IMO. As long as Gold keeps rallying, the liquidity spigot is alive and well. I think the first shots of waning liquidity will be fired in the emerging markets, the junk bonds and then the Gold markets. It's only then the stock will start a major long term correction. Until then i think we continue with this frustrating sideways to upward grind......
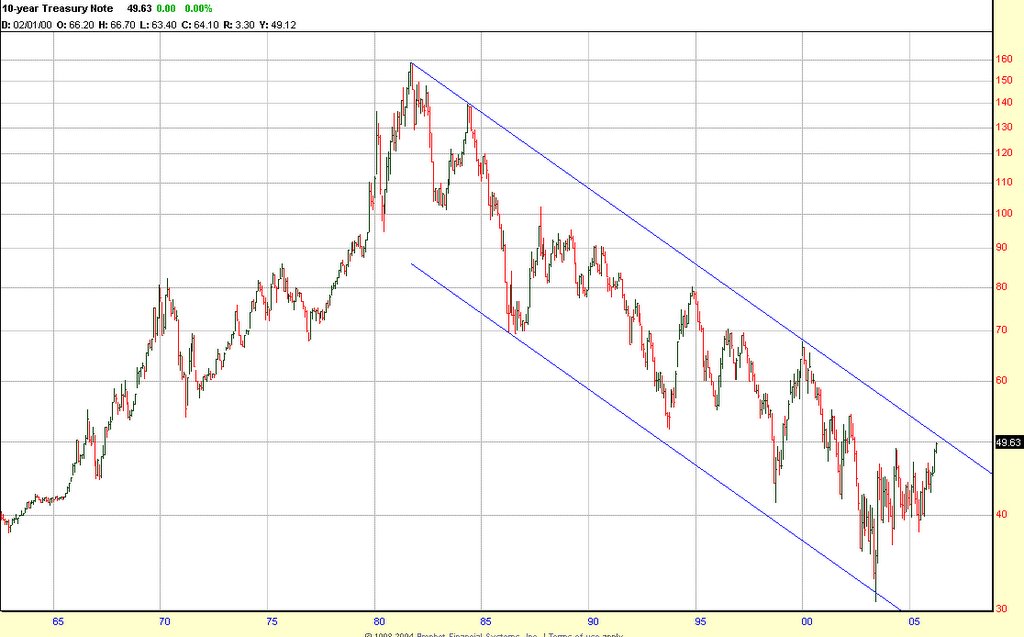
What's spooking the market right now is the 10-year yieds challenging the 25 year old declining tops line. If the 10-year yields break out of the channel shown in the chart, then the technical implication is that a long term trend change has occured in the long end of the curve. Now that does not mean the yields will melt up in the next few months or we will bust thru the channel immediately. Such multi-year resistances are generally not taken out in the first attempt. So we may have to challenge this resitance a few times, before we break out. The bond market vigilantes, if they still exist (LOL) have finally awakened from their deep slumber, it seems.
The global liquidity glut has reached insane proportions. My guess is the Fed would increase the rate by 50 basis points in May, just like they did in May 2000 (when they increased from 6 to 6.5). It could be deja vu all over again. Again that's just my guess, which i beleive will be necessary, if they were to avoid a bond market and dollar carnage here. I think the stocks will continue it's sideways to upward bias until this ocean of liquidty is worked off, which will take a while IMO. As long as Gold keeps rallying, the liquidity spigot is alive and well. I think the first shots of waning liquidity will be fired in the emerging markets, the junk bonds and then the Gold markets. It's only then the stock will start a major long term correction. Until then i think we continue with this frustrating sideways to upward grind......
Tuesday, April 04, 2006
Mired in a trading range
Nothing much to add. We have been mindlessly zig-zagging in this trading range for the last couple of weeks. To me it appears like a high level consolidation before the breakout, which are supported by the internals.
NYSE cumulative A/D line - new highs (both daily and weekly)
Nasdaq cumulative A/D line - new highs on daily
High TRIN, High P/C at or near market highs
There was a small change on the Nasdaq MCO today. So expect some big volatility in this index over the next couple of days.
NYSE cumulative A/D line - new highs (both daily and weekly)
Nasdaq cumulative A/D line - new highs on daily
High TRIN, High P/C at or near market highs
There was a small change on the Nasdaq MCO today. So expect some big volatility in this index over the next couple of days.
Subscribe to:
Posts (Atom)

