No updates till 1/2/06.
Happy holidays all !
Saturday, December 24, 2005
Wednesday, December 21, 2005
Bearish Backkiss on the hourly charts

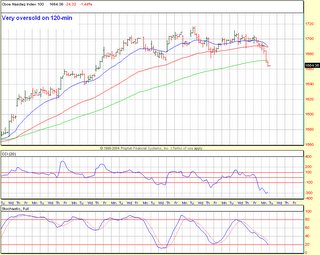
As i mentioned on Monday, the 120-min on NDX was in a deeply oversold condition and a bounce was overdue. Today we bounced hard but reversed nastily into the close, creating a bearish backkiss on the hourly EMAs and a zero line backkiss on the MACD. This suggests that there's more work to be done on the downside. Today's high should remain intact for the bearish case here. If today's highs are taken out, it would confirm a reverse divergence setup on the daily charts, which would lead to new recovery highs on all the indices. I doubt that's the case given the rally failure today, but it helps to be open minded when it comes to trading.
Overall we remain in a overlapping choppy market. So these days i tend to trade the 15-min and hourly charts to maximize gains. Trading is not really a sophisticated game that requires one to use Fractal geometry, Parabolic curves, Gann angles, Neural networks Fourier analysis, Spiral calendars et al to make money. They all look sexy on the charts, but not add much to the trading bottom line. Throw in a bunch of EMAs to follow the trend and moementum indicators to signal the reversals and you are all set.
Good luck trading and happy holidays.
Monday, December 19, 2005
Hourly sell on all the indices

The hourly went on a sell on all the indices today - DOW, SPX, NDX and RUT on both momentum and trend basis. There were no-brainer setups to go short today, if one followed the 15-min charts. Here we are in a seasonally bullish period and technically awful looking markets.
The e-wave count on NDX got invalidated as soon as we broke below the lower trendline of the triangle. That's why it pays to watch the momentum indicators and not get married to the wavecount. The 120-min on NDX tells the story for today, which is extremely oversold. A -300 reading on the CCI(20) and it has hooked back above it. The Full Stoch is almost oversold.
The daily on the NDX suggests two possibilities, either a slingshot reversal from here or a trip to 1640-1645 where it meets the 60 EMA, just to get everyone beared up and another attempt at nominal highs. If we were to make any nominal new highs on the indices here, the upmove have to be swift i.e a slingshot kind of move. Instead if we churn sideways after the decline, the bear has started....
The daily CCI on the SPX is right near the zero line, where a reversal can start anytime. I am not too beared up on DOW and SPX at this point as far as swing trading is concerned. Both are right at the support zones. If we fail here, then 1240 (SPX) and 10680 (DOW) would be next major support zones.
Subscribe to:
Comments (Atom)