Since my buy signal 2 days back, the market has rallied nicely. The daily CCI on the SPX moved above the 100 line today. This is where the rubber meets the road. This is where the price acceleration takes place. But then, this is also the place where the price failures happen. Since my system (or any other system for that matter) is built on the premise of beleiving the signals and not on anticipating the signal failures, i would give the benefit of doubt to price acceleration here, with stops just under today's lows at 1280.
There seems to be no dearth of liquidity in the marketplace. Both the daily and weekly cumulative A/D line on NYSE are at new highs today. It's just a matter of time the price will !
http://stockcharts.com/gallery/?$NYAD
Thursday, February 16, 2006
Tuesday, February 14, 2006
SPX buy signal on daily
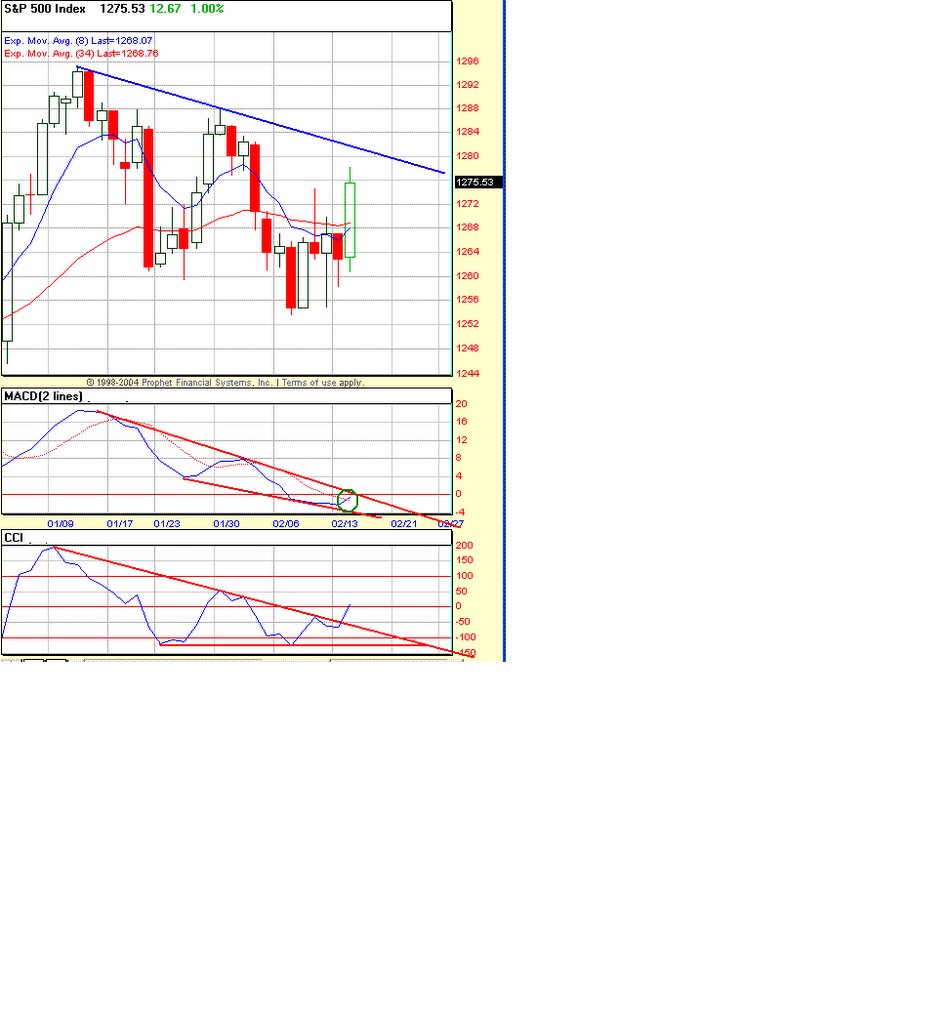
As i noted on 2/10/06, all my indicators were compressed in a wedge. Today the CCI broke out of that compression. My MACD indicator had a crossover. My system gave a buy signal at the close on the SPX daily charts. Note that my system is based on the indicators i have shown in the above charts and some more. But the buy/sell signals are based on objective intrepretations of the indicators, which are strictly rule based without any of my subjectivity coming into picture.
Momentum is always a leading indicator, which breaks out before the price. The price is yet to take out the declining tops line, which would add confidence to the signal. Bottomline, my daily is on a buy as of today's close after being on sell since 2/2/06, which means i will start buying pullbacks instead of shorting strength.
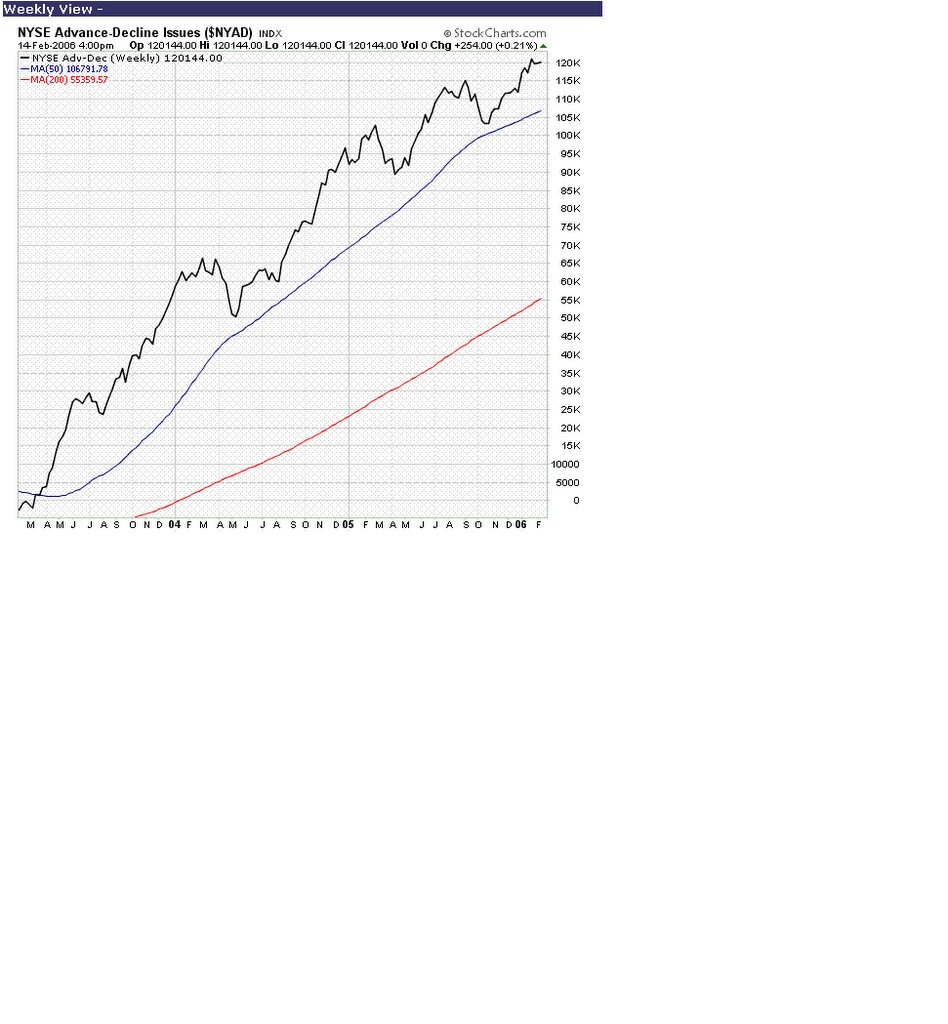
Meanwhile, the NYSE weekly A/D line continues to remain in a very constructive mode. Hard to get bearish, from a intermediate term perspective, against such strong inflows of liquidity into the marketplace .
Subscribe to:
Posts (Atom)
