Assuming that we did a wave A yesteday and today's rally was a wave B, then the most obvious way this decline should start is that wave B will either top below yesterday's high or double top at yesterday's high and then do a wave C selloff. What concerns me here is everyone is aware of that pattern and this is what the technical traders are expecting.
What would fool everyone is a tactical play here. There are two ways to do that...
1) Expanded Flat - Wave B will make new highs and then a violent wave C down which will bottom below wave A.
2) Running correction or a irregular flat - Wave B will continue this choppy advance way higher than most shorts would want to be comfortable with and then a wave C decline down which will bottom above today's low.
Both these scenarios can confuse the heck out of everyone. If we make new recovery highs tommorow, then i will start looking to go long on any decline, instead of looking for shorts anymore.
Wednesday, March 22, 2006
Tuesday, March 21, 2006
SPX momentum sell signal at close
As i noted yesterday the bollinger band squeeze resolved to the upside. Late day we had a nasty selloff. The small change on Nasdaq MCO for 3 consecutive days was warning about some nasty volatility to come. We saw that today. Well that 1315.93 resistance (2001 May highs) proved to be formidable. It's not typical to clear such a multi year resistance on the first attempt. All beared up ? Don't...
NDX is in a daily sell for a long time and it has totally different configuration and is more vulnerable to a downside surprise. Nasdaq summation index is also ready to curl below zero, which won't be a pretty thing if it does.
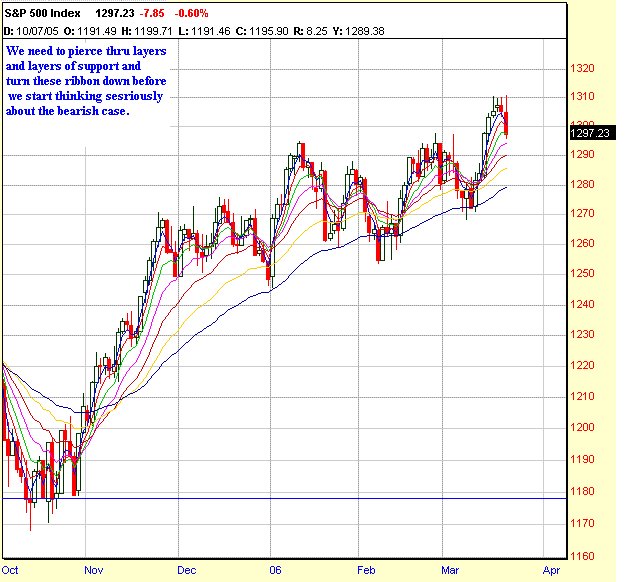
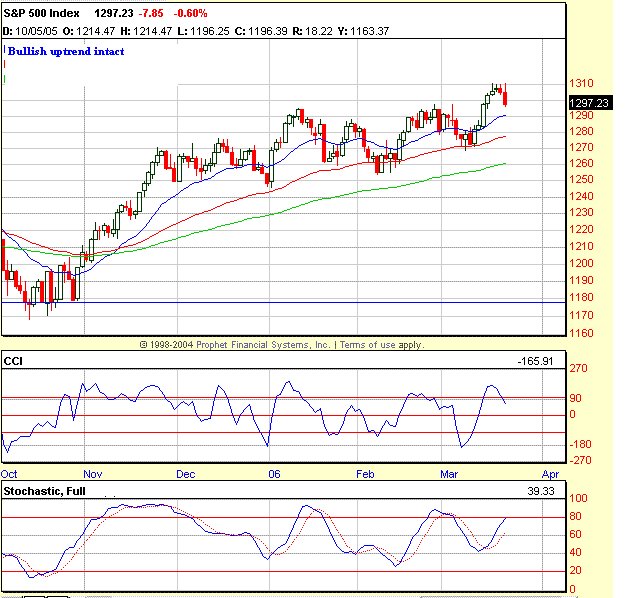
Let's focus on the SPX. SPX is in a solid uptrend so far, but with that nasty close today, my system generated a momentum sell at the close. The price trend as evidenced by EMAs is still up without a question. But the momentum went to a sell today. When this happens we typically go down and test the rising EMAs. Remember we had gotten far above the rising EMAs. So some correction was required to bring the prices back to mother earth. I think the brutal selloff we saw on SPX was a wave A selloff. We should see another wave B up and another wave C down to about 1290-1295 region before the uptrend resumes. We have had a nice 5 wave impuse from 3/8/06, which would qualify as a wave 1. So my best guess at this point is we are in a wave 2 correction, which should end at the 50% retrace of the impulse, which is around 1290. After that i expect a strong persistent wave 3 advance, which should purge all the remaining bears. This scenario could change if we get a daily close below 1290. For now this remains my preferred count.
Another techincal matter of interest is that the daily CCI on the SPX went above 220 during this runup. Market does not do certain things without intentions. In the past on those rare occasions when the daily CCI had gone above 220, it had resulted in major trending phases. I don't have time to post those charts. But take a look at 1997-2000 when at least 4 or 5 times the CCI went above 220 and checkout what happened after that. It could be an eye opener.
The sentiment picture is very interesting. I have never seen so many bears at the top. With so many rydexers shorting the indices from their retirement accounts, it's hard to conceive a major bull market top happening here. There's simply no acceptance of the rally. Everyone is either obsessed or worried about a 4-year top here. Whether we made a 4 year top or not is totally immaterial from a trading perspective, unless you are advisor trying to make a name for yourself or keep your subscription base sufficiently excited. I am sure a host of advisory services today will be screaming 4-year cycle top from their rooftops !
None of the daily signals i have got this year on SPX have failed so far. I have a sneaking feeling that this sell signal could end up in a whipsaw.
Bottomline , the next couple of days or as long as this sell signal is alive, i will be looking to short the indices on a intraday basis. I am not comforatble taking a swing short position at this stage at all.
Monday, March 20, 2006
Bollinger bands are getting squeezed
The SPX daily remains on a buy signal.
On the SPX hourly the bollinger bands are squeezed tight. Today appeared like a high level consolidation on the hourly charts. The hourly oscillators are oversold with little damage to price. So my guess is this consolidation will resolve to the upside tommorow.
Nasdaq has had 3 consecutive small change days on the MCO. This means a big price move is coming in the Nasdaq in the next day or two. The price move tends to be large when we have such huge indecision on the MCO (in this particular case for 3 days). Caution is the keyword here.
Subscribe to:
Comments (Atom)
