Wednesday, November 01, 2006

What next ?


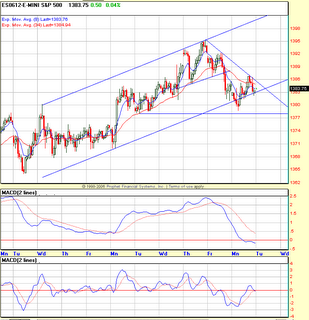
1370.75 it was ! Remember my call from yesterday was for a move to ES 1367-1370 - we acheived that technical objective today. Technically it was a nasty move - a 3 sigma move. On the 120-min chart i have shown 3 instances from 9/11/06 when we hit the 3 standard deviation band (on 20 EMA). Two of the prior instances on 10/3 and 10/11 resulted in barn burner rallies. Will it be a replay of the same this time ? I don't think so. Notice the bands were compressed in the prior two moves, while it's expanding and turning down now i.e a potential change in trend. The daily context was on a solid buy then, and back then i was a frothing bull. Right now the daily is on a momentum sell. Well, anything can happen in markets, but we have to play the odds. Given the 3 sigma touch today at 1370.75, a reflex bounce is a given, which is why i covered all my shorts at 1372, which i posted in real-time on traders-talk. Now how big is the bounce gonna be is anyone's guess. Given the technical condition, any bounce tommorow morning will be likely sold. So will reshort on any bounce and see how it goes. If the selloff results in a positive divergences on the hourly charts, i will consider going long for a counter-trend trade. If we break 1367 and accelerate to the downside, it can get nasty in a hurry. It's all speculation at this point. Gotta watch the tape tommorow to see what happens. For now, i am neutral, but looking to short tommorow morning.

I don't have the time today. But i will definetely post the updated daily charts tommorow, which warned us last Friday.

Bottomline - Bearish ST, Bullish IT/LT
Tuesday, October 31, 2006

Land of the quick or dead !

All my indicators, measured move projections, dyanmic support on 120-min, dynamic support on daily, e-wave projections are all pointing to ES 1367-1370 area (SPX 1360-62 cash) for tommorow. BTW, someone dumped nearly 65000 contracts in the last 5 minutes of the trading. That's huge and means something. I guess we will know tommorow. They have been jerking the price all around, the last two days, confusing the heck out of the bull and bears alike. But the hourly trend indicators have been essentially saying the same thing, despite all those gyrations - DOWN !

Another small change day on both the NYSE and Nasdaq MCOs. Two back to back small change days on the MCOs, which are not very common. Nasdaq MCO flipped below zero pointing the summation index down. NYSE MCO ready to plunge below the zero.

Tommorow will a strong day either up or down - no ifs and buts. The odds of a strong move down is about 80%. It's about as good as it gets in TA. If such strong odds do not transpire and the market decides to move above 1392 ES, i will throw aside all my opinions and join the long side. Right now, all my work points down and i remain short from last Friday. I don't have to sweat sitting on the house money. So will give it some time.

Bottom line - ST bearish, IT/LT bullish.

Monday, October 30, 2006

ES 30-min trend


Keeping it simple for now. The 30-min trend is clearly down for now. We need to just let the trend play out. The slow Osc is clearly down, with no positive divergences yet. The fast one is turning down. The key for tommorow is whether we can break the horizontal support at 1378. If we can't break 1378, then the downtrend could be in trouble and we could see a larger sideways consolidation i.e no money for bears unless you flip in and out based on the Fast Oscillators. If 1392 is taken out, then then the correction is over.

Small point change on both the NYSE and Nasdaq MCOs. So it will be an exciting session tommorow.


Bottomline : ST bearish, IT/LT bullish

Sunday, October 29, 2006

Rejection at channel resistance


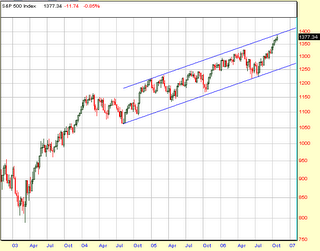
The indicator i talked about yesterday which was warning about a potential top did produce a reaction which occurs near ST/IT tops. The MACD crossed over and the Full Stoch broke below 80, as i suspected. Look how nicely the price was rejected at the channel top (SPX 1389), which i have been talking about for the last 15 days. 1365-1388 SPX cash was my projected topping zone. We have likely topped for the ST and headed towards the first potential support at 1362 and then eventually towards the 1350-1355 area. According to my work, a weekly close below 1356 is required to confirm that a IT top has occured. Otherwise this would end up as another ST top and a retest of the current highs cannot be ruled out.

Bottomline : ST bearish, IT/LT bullish.