Thursday, March 02, 2006
Sell signal on SPX
My system issued a sell signal on the daily (both SPX and DOW) at the close, after being long since 2/14/06. Any new recovery highs on SPX will invalidate the sell signal. Will start looking for shorts tommorow.
Wednesday, March 01, 2006
Don't short a high TRIN day !
When the market is already downtrending and the TRIN goes high, it's indicative of a washout or climactic kind of downmove to come. When the market is at the highs or making new highs and we get a high TRIN day, it's indicative of VST panic, typically induced by fundamental events and a buying opportunity for those believe in the trend. Yesterday we had a NYSE TRIN of 2.2, barely a day after making new recovery highs. That's a tough market to short in my opinion.
Like a broken record i have been saying over the past week that the market is an yellow zone, where it's vulnerable to bear attacks and that's precisely what happened yesterday - GOOG news induced panic selling. The NYSE MCO dipped below zero which caused some excitement among the bears. As i have been saying, as long as the MCO 5% and 10% components are comfortably above the zero line, a temporary dip by the MCO below the zero line is a non-event. It appears that the weak hands have been flushed now and the market appears to move higher.
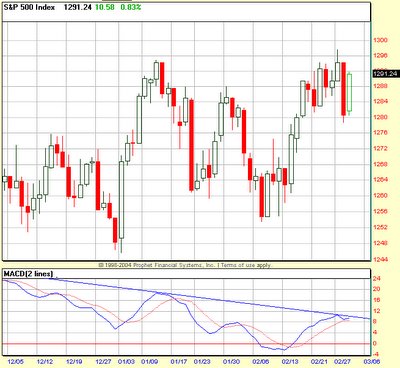
One of my trusted indicators (MACD), which i have been discussing over the last week for a potential triple divergence sell, curled down yesterday, but did not generate a crossover. Today it appears we had a backkiss on this indicator. So if the market consolidates over the next day or two and blasts higher, the MACD will blast thru the declining tops line on the MACD, in which case look out above.
My system remains on a buy signal since 2/14/06. The hourly which had turned down yesterday, has turned back up today. Bottomline, i will continue to buy the dips on the hourly charts, until the daily turns down.
Tuesday, February 28, 2006
Close but no cigar
My system is on a hourly sell, but the daily remains on a buy signal. It went close to a sell, but did not generate one. As i posted yesterday, we still remain in a "Yellow Zone", Where the daily trend and momentum is neutral at this point. It could tip either way. To keep it simple, if the hourly turns up, i would start looking for long trades again. If the daily turns down, i will join the bears. If today's support fails on the SPX, the next dynamic support on the SPX daily comes around the 1270-1272 area.
The MACD chart i posted yesterday has curled down, but yet to give a crossover. Crossover or Kissback ? - I guess, we'll know tommorow.
The MACD chart i posted yesterday has curled down, but yet to give a crossover. Crossover or Kissback ? - I guess, we'll know tommorow.
Monday, February 27, 2006
Still in the Yellow zone
My system remains on a daily and hourly buy signal. However, my indicators continue to remain in the "Caution zone". My MACD is still in a zone where it could curl under and give a triple divergence sell or break thru the overhead resistance and trigger a massive short covering. Until more clues surface, the trend is up, and i will continue to trade the long side.
Subscribe to:
Posts (Atom)
