Saturday, November 19, 2005

SPX daily charts - 11/18/05 - 1260 is a magnet now


Daily - buy Weekly - buy Monthly - buy

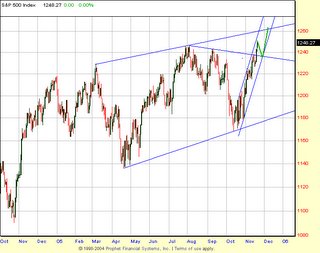
My sell signal got invalidated when we took out 1237 on SPX cash and got stopped out on my shorts for a 5 point loss. Now SPX 1260 is a magnet for various reasons. The declining tops line was taken out, which almost gauranteed that we would make new recovery highs in the index.
Now if we rally in the next few days without a pullback,1255-1260 is where the upper trendline of the hourly trendchannel is for the next couple of days. 1260 is where the upper trendline of the wedge on the daily charts is. 1260 is the exact measured move target from the rectangular consolidation on the hourly charts is.

Given how well all the technicals are pointing to 1260 and the underlying bullishness, i think we will end up exceeding the 1260 target. There is no low risk trade at this point given how overbought the market is. My strategy will be to try to buy the pullbacks with close stops.
My hourly indicators are suggesting a pullback early next week and i expect a retest of the declining tops line around 1235 and then another leg up to 1260+. If the declining tops line does not hold, then a retest of the channel support at 1225 will be in order.

Wednesday, November 16, 2005

SPX Daily - 11/16/05

It was a lacklustrous day for stocks. The market went into a boring sideways consolidation, which looks like a bear flag for now. As noted yesterday, i went short at the open on Dec ES at 1234.50. Stop at 1241. 50. Bonds and Gold were the stars today. Both SPX and NDX remains on a sell signal. SPX should decline towards the chnnel support on the hourly which lies around 1214-1216.

Tuesday, November 15, 2005

SPX Daily - 11/15/05 Sell signal on SPX and NDX


I said yesterday that if we convincingly close above the declining tops line, the upper trendline of the wedge would be a magnet. Instead we have had two consecutive failures at the decling tops line and SPX had an outside reversal day today. Also my system generated a sell signal on both SPX and NDX at the close. DOW is still on a buy and will probably crap out tommorow.
I will go short the market tommorow morning on any retracement with a stop above today's highs. This is as good as it gets for the bears.

Monday, November 14, 2005

SPX - Daily charts - 11/15/05


Signals

Daily - Buy, Weekly - Buy, Monthly - Buy


So far the price action is very constructive for a bullish up move here. The breakout of the rectangular consolidation last week has a measured move to spx 1260. However the daily and the hourly are very overbought here. So a sideways consolidation and another breakout to 1260 appears very likely. The breakout above the downtrend line will almost assure that the A-C-E trendline will be tagged. I am not married to the measured move targets here. Given how the weekly and the monthly are positioned here, any daily sell signal here should be treated with respect.

SPX - Weekly charts - 11/13/05


The weekly Full Stochastics never got anywhere near oversold in the recent down move. It still remains on a weekly sell. We could be in a fake up move like the one we saw during June 2004. This indicator warrants caution on the bullish side ! Any failure here will end up as a backkiss and could lead to swift price decline.

Monthly charts - November 2005


The 20ema continues to provide support for the monthly uptrend. As long as the price action is above 1170 (breakout above the 2002 highs), the monthly structure remains bullish. However the fly in the ointment is the price broke down from the upsloping channel from the 2003 March lows. While the price has been grinding up in a belaboured manner in a wedge, the momentum oscilators have been going sideways. Look at the Monthly CCI which is stuck in a sort of bear flag oscillating back and forth. Even more telling is the Monthly Full Stochastics which has been flat-lining for nearly an year. Wow, that's an incredible acheivement, thanks to our program trading folks for having squeezed the volatility completely out of the market. I went back and researched 70 years of price data and could never find a similar Stochastic configuration for that length of time. Once we break down from the bear flag on the CCI and a decisive break down below the 80 level on the Stochastics, we should start a multi-month bear decline in earnest. Right now all the indicators are flashing warning signs on a monthly basis, but remains on a buy nevertheless.