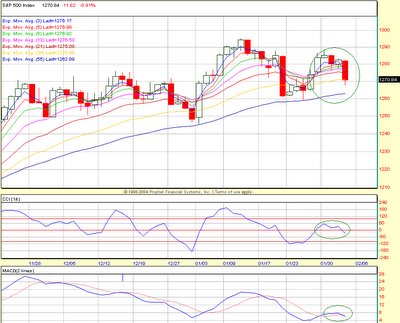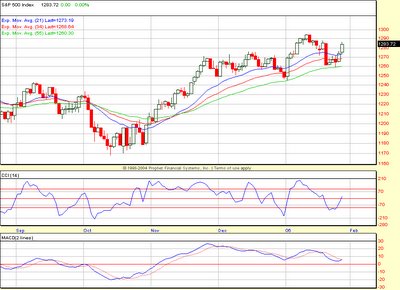
My system generated a sell signal on SPX at close. Look how the ribbons curled back down below. The CCI briefly went above zero flirted there for a couple of days and now it's back below zero again. My MACD indicator also had a crossdown. All point to a retest failure and what i call as a secondary sell signal. Classic whipsaw action. Reminds me of 10/04/05.
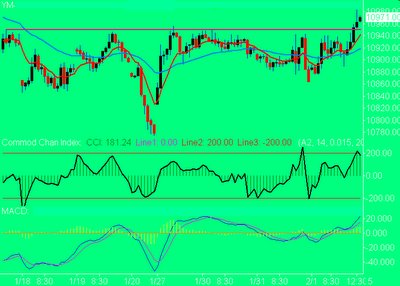
Nasdaq and NYSE MCOs turned back down below zero again, pointing the respective summation indices down. What a difference a day makes ! Yesterday it seemed like a hourly breakout on the DOW, which turned out to be a big fakeout.
Let me make it clear. My job is not to predict the future or provide target projections. It's to identify the trend reversal points and align with it. My system has done a darn good job in identifying the reversals. Here's the daily buy/sell signals for 2006:
1/13/06 - Sell
1/26/06 - Buy
2/2/06 - Sell
Can we get a whipsaw again ? Sure we can. It's not my job to predict the signals from my system. I don't anticipate my signals nor do i double guess it, when i get one. I have paid dearly when i have done that in the past. Right now we have a sell and let's go with the flow, until it reverses.

