Click on the chart to enlarge it

A little bit of history and perspective. This is all again of no trading value and is of only academic and intellectual interest. If you are not interested in that, please skip the following section.
There were calls that 2000 ended a secular bull market. Nothing could be further from truth. The only sector which made a secular top in 2000 was the tech. Most other major and minor indices took out the 2000 top after the bull started from 2003, some marginally and some by a large extent. Fortunes were made in virtually every sector of the market globally, while the permabears were crying bear market rally for 5 years. While the term secular can be subjectively intrepreted, e-wave does not allow that luxury. It's hard to categorize a top as secular when more than 80% of the sectors make their lifetime highs.
The advance out of 2002 mean't two things
1) A major cycle degree advance has begun from 2003, which is what i beleived.
2) The primary degree wave 5 of CYCLE III was in progress.
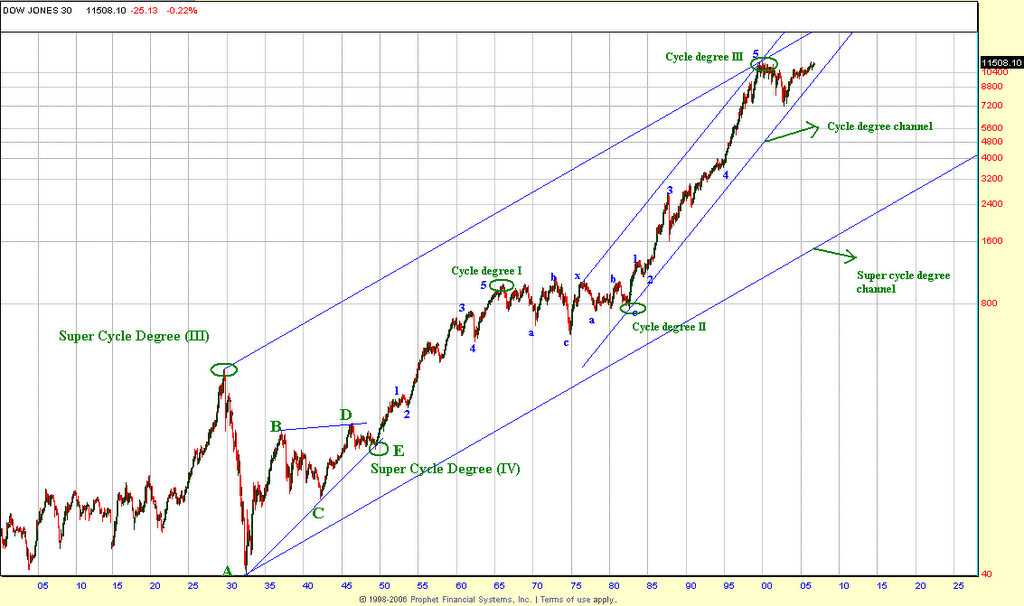
In hindsight, it is now apparent that 2) was correct and we were concluding the large secular advance from 1975. The 2002 lows never broke the CYCLE degree channel from 1975, leaving the CYCLE degree advance intact. We have now broken that CYCLE degree channel, which means 2007 marks the CYCLE wave III top and a CYCLE wave IV is now in progress. The LT support for CYCLE wave IV should come near the lower degree wave 4 (primary degree wave 4 of CYCLE III) which is the Oct 02 lows. We will probably undershoot the Oct 02 slighly before the bear is over.
This is a chart i posted on my blog a few years back. Given that this bear has progressed to a higher degree, i will have to make a structural adjustment by moving the CYCLE III top from 2000 to 2007.
Very LT count
Click on the chart to enlarge it
Since this is a CYCLE degree bear market as opposed to the Super Cycle degree bear of 1929, the economic conditions during this decline will be no where as worse as 1929. We are dealing with a wave of degree less than 1929. Nevertheless it's going to be tough times for the next few years. Cash will be king. A major value buying opportunity will arise in the months and years ahead, but irony of every major bear lows is that folks will be scrambling to find money for their next meal and buying stocks will be the least of their worries/priority, when it presents itself. Stay defensive !
Once again, wild projections like DOW 4000 and DOW 400 are getting thrown around. It doesn't cost money to make such wild projections. Can it get there ? Who knows ? But do we have technical projections for that ?. Nope !. To come with LT downside projections, we need a intermediate term multi-month rally here, which fails on an intermediate term basis. Right now we are in a free fall with no bottom in sight. The bottom could come anyday, between here and SPX 700, after which a intermediate degree bear market rally should begin. VXO hit 100+ and the volatiltity is insane. Trade Safe ! Good luck.

