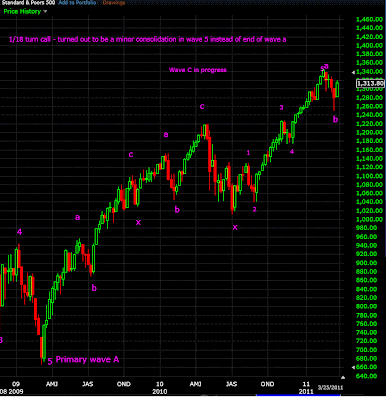
The reversal from 1249 was brutal and caught me by surprise. There was no bottoming action whatsoever. March 24 close at 1311 turned my trendicator on daily charts from downtrending to uptrending. So minimally we have a challenge of the 2/18/2011 highs at 1344 and possibly higher than that. Now just because my trendicator turned to uptrending does not unequivocally say that a "V" bottom is the case. But i don't like using alternate count to hedge myself if i am wrong. It is what it is. As a trader i need a firm bias to trade. From a trading viewpoint, SPX 1311 close was a buy point. Any dip can be used to add more. A break below the March 24 low at 1297 would be the stop for the trade and would also put a "V" bottom in question. For now both the hourly and daily are trending higher and the trade is long. If anything changes, i will post a quick update here. Here's the updated e-wave chart
