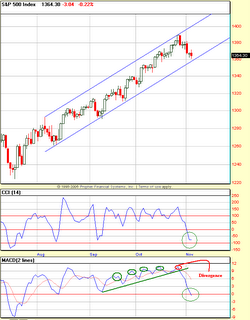
Hourly sell from Tuesday is still in effect. We had a post election gap-down, which pushed some VST indicators to extremes, causing that recovery on Wednesday. Today we gave up all that gains. Now the hourly is nowhere near oversold conditions, to worry about any major rally here. Based on 30-min and 60-min indicators, we could bottom tommmorow morning somewhere around the 1376-78 area, which should lead to a small bounce before another leg of selloff starts....
Bottomline: ST bearish, IT neutral, LT bullish.
Thursday, November 09, 2006
Tuesday, November 07, 2006
No blowoff !
I was wrong yesterday expecting a blowoff to SPX 1398. SPX went to 1388, double topped and sold off. As we approached the double top area, i posted this heads up on traders-talk.com
http://www.traders-talk.com/mb2/index.php?showtopic=62140
One chart says it all for today ! 60-min is now back on a sell. This signal has a pretty good track record catching the hourly swing turns. Fade it at your own risk.

http://www.traders-talk.com/mb2/index.php?showtopic=62140
One chart says it all for today ! 60-min is now back on a sell. This signal has a pretty good track record catching the hourly swing turns. Fade it at your own risk.

Monday, November 06, 2006
Terminal blowoff !

The bounce that i described yesterday came right on schedule. Now i am pretty sure, based on the e-wave pattern that we are in a terminal blowoff, which should take SPX cash to 1398-1400 region and conclude the intermediate term advance from July lows. Once this IT advance concludes, we should see a multi-month selloff in SPX to about 1300-1320 region.
Sunday, November 05, 2006
Approaching a traedable bottom


Remember the first chart that i posted on this blog on 10/27, warning a potential ST top. The call was right on the money and we satisfied out ST objective of ES 1367. Now the second chart is showing the MACD right at the zero line support. Howvever the CCI has a teeny bit of work to do on the downside. What is more important is that the hourly chart is showing positive divergences and the 120-min is putting a complex bottom on the Full Stoch. All of these are warning signs that a traedable bottom is approaching. I am seeing the ES 1358-1364 zone as a potential bottoming zone. We might mess around this zone for the next day or two. But the risk of rally increases here. I will be playing the long side this week.
Subscribe to:
Comments (Atom)