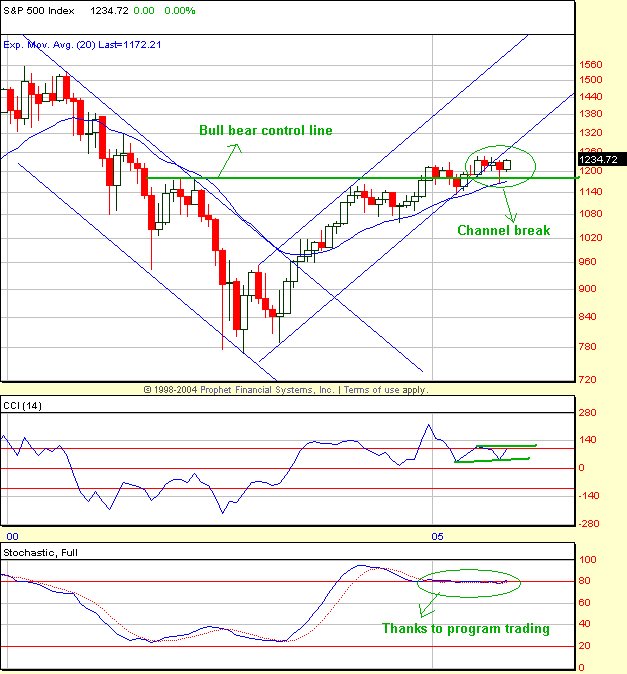
The 20ema continues to provide support for the monthly uptrend. As long as the price action is above 1170 (breakout above the 2002 highs), the monthly structure remains bullish. However the fly in the ointment is the price broke down from the upsloping channel from the 2003 March lows. While the price has been grinding up in a belaboured manner in a wedge, the momentum oscilators have been going sideways. Look at the Monthly CCI which is stuck in a sort of bear flag oscillating back and forth. Even more telling is the Monthly Full Stochastics which has been flat-lining for nearly an year. Wow, that's an incredible acheivement, thanks to our program trading folks for having squeezed the volatility completely out of the market. I went back and researched 70 years of price data and could never find a similar Stochastic configuration for that length of time. Once we break down from the bear flag on the CCI and a decisive break down below the 80 level on the Stochastics, we should start a multi-month bear decline in earnest. Right now all the indicators are flashing warning signs on a monthly basis, but remains on a buy nevertheless.

No comments:
Post a Comment