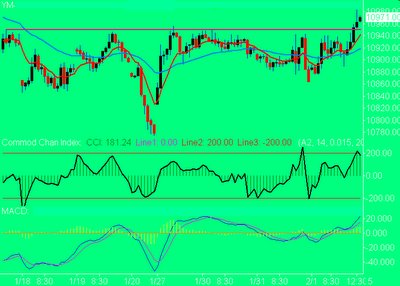
The daily on the SPX and DOW remains on a buy. We have an interesting pattern in the DOW. Seems like we are breaking out of a reverse Head & Shoulders patters, which means there's another 150-200 points on the upside left before any serious correction kicks in. Above is the hourly chart of the YM (Dow E-mini), which shows the breakout.
No comments:
Post a Comment