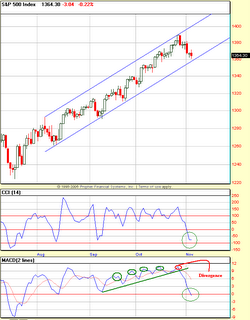

Remember the first chart that i posted on this blog on 10/27, warning a potential ST top. The call was right on the money and we satisfied out ST objective of ES 1367. Now the second chart is showing the MACD right at the zero line support. Howvever the CCI has a teeny bit of work to do on the downside. What is more important is that the hourly chart is showing positive divergences and the 120-min is putting a complex bottom on the Full Stoch. All of these are warning signs that a traedable bottom is approaching. I am seeing the ES 1358-1364 zone as a potential bottoming zone. We might mess around this zone for the next day or two. But the risk of rally increases here. I will be playing the long side this week.
No comments:
Post a Comment