The same signal which gave a daily buy back in March is now on a triple divergence sell. Some rough IT targets for this decline at this point is around SPX 1450-1460. Will refine it, as we move forward. The NYSE MCO has created a new flag, which means the internal low is probably in and the price low in the form of a lower low is pending. If that lower low on price creates a positive divergence with the MCO, then we should expect another leg-up towards new recovery highs. But it's too early to speculate on that. As for a "V" bottom here, i am not a beleiver. In any case, "V" bottoms have 20% odds as opposed to 80% odds for a retest. So i am positioning myself for a retest.
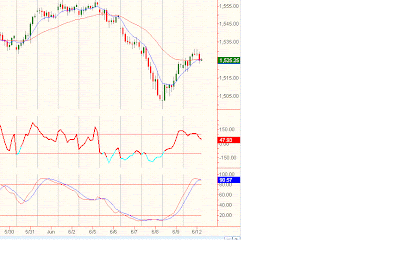
VST chart

The Full Stochastic on the 60-min chart is fully overbought and is turning down. The EMAs are on the verge of a backkiss. The 60-min CCI diverged and has turned down. So the odds that the bounce from Friday is over, looks very high.
3 comments:
To what extent, if any, has the Friday expiry affected your signals? Just wondering if that is part of your game plan. Thanks
Jim,
I don't publish my VST analysis on this blog. It's mainly for ST and IT timeframe analysis. When i see some important turning points, i publish here. If you are interested in my VST analysis and trading, i post them on traders-talk.com under the name NAV
BTW, from a VST perspective, yesterday was most likely a secondary top of this correction and we should soon start heading into SPX 1450-60 area.
Post a Comment