Well, it would be foolish to say that nothing changed since my last update on 3/9/09. The hourly which has been downtrending since 2/9 has now started uptrending. Since we have not had any meaningful pullback since this bounce started on 3/6, it's hard to come up with upside targets for this move at this point. But clearly the big resistance is around SPX 780.
The ST and IT trends are unambigously down. Many claim that we seen an IT or a LT bottom here. But those are just claims, until proven right by the market. I did not see any bottoming action based on my indicators on 3/6. A high volatile move suddenly morphing into a low volatile bottom is not something typical. Had the market put a high volatile wide range reversal bars, leaving most behind, then it would been a signature of a long lasting bottom. But this bottom seemed to accomodate everyone !
Let's first get the daily (ST) uptrending and then we can discuss about the IT. If SPX takes out 780, then the ST(daily) would start uptrending, suggesting that the market has legs. But for a ST or IT trader the trend remains down and shorting seems to be the safer, high odds bet (until 780 is taken out).
This week's market action should provide more clues. Will post an update next week.
Monday, March 16, 2009
Monday, March 09, 2009
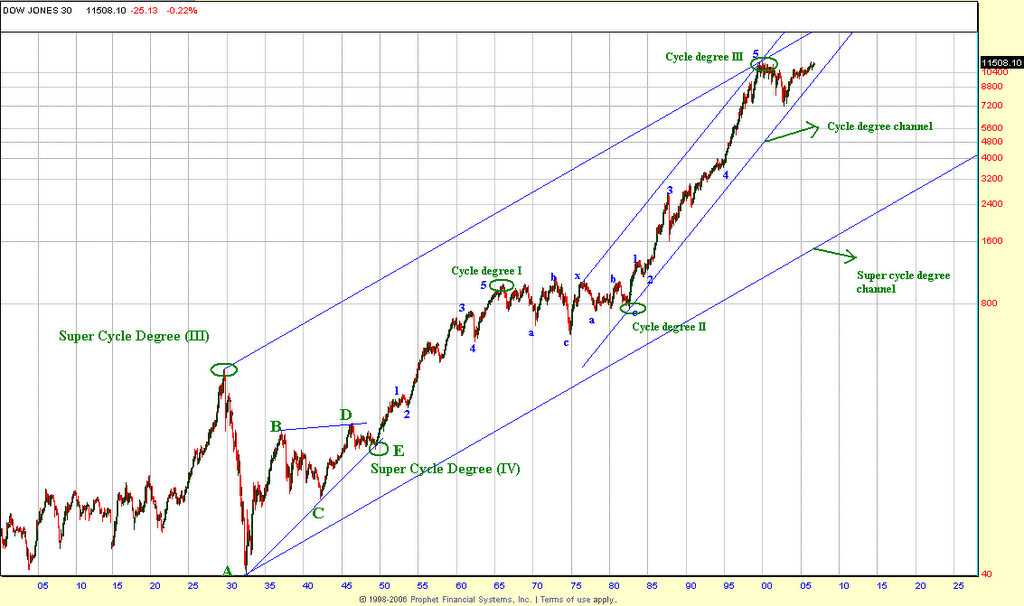
Elevation of degree of bear market
Initially when i made the LT sell call in Jan 2008 at 1380, i thought it was a primary degree bear market. Then after the break of 1170 and the CYCLE degree channel, i elevated it to CYCLE degree. Timely elevations and updates are all on this blog.
Now here's something that i had not looked at, for the last few weeks.
The last CYCLE degree bear market in SPX had it's largest correction during 1973-74, of about 48.5% from it's top, in about 22 months. The current bear has lost about 56%in just 18 months on the SPX. So this qualifies as the largest, fastest drop after 1929. So the odds are we are now dealing with a degree higher than the 70s bear market, higher than a CYCLE degree bear market. I am elevating this to a SUPERCYCLE bear market.
Again, this is not what i think. It is what it is. It is what the market is saying. Absolute definitions of degree can be argued, but the relative aspect is clearly visible on the charts and amenable to measurements. That makes it an objective observation, rather than my personal judgement or decree.
All divergences erased
Price trends, breadth and momentum are my primary tools. Recall when i called the top in January i was looking for a test or break of Nov lows. At that point it was not clear whether we would get a retest or a break. But before SPX broke the Nov 08 lows, the NYSE MCO broke it, implying that SPX would. I have been hearing about these gut wrenching bear market rallies since the Jan top, because of all the divergences. Now let's get the fact straight.
1) NYSE and Nasdaq MCOs broke the NOV 08 lows
2) NYAD (cumulative bredth) made fresh new lows both on daily and weekly cumulative basis
3) NYUD (cumulative volume) made fresh new lows both on daily and weekly cumulative basis
So where's the divergences ? Bulls are making the same mistakes that bears made during that persistent advance post june-2006. Sentiment seems to be the hook here again. What's the point of looking at AAII i.e what the suckers are doing/thinking when the big money is voting for a down market, which is amply visible on the breadth charts ? How do we know if these AAII folks are even actively involved in the markets ?
As for the 9 month cycle crest, the only conclusion i can come to, given that we did not get any rally into the crest is that it may have severely left translated. If that is the case, then we may be looking at a July bottom (a la 2002). But that's pure speculation. Let the market tell the story. The downtrend continues....
Tuesday, March 03, 2009
Update
On Feb 20, i made 1001 arguments as to why there was a potential for a ST bottom and a rally. It took one day for the market to crush all those beautiful arguments. If there's one thing i have learn't from markets, resist from making calls against the daily trend when the hourly is still in harmony with the daily. In other words, wait for at least an hourly turn.
On Feb 23 (the very next trading day), i followed up with an update on this blog and went bearish. Not because of what the price did, but because of what the NYSE breadth MCO did. I said, Nov 08 lows on SPX will not hold since the NYSE MCO has broken the Nov 08 lows. Nasdaq which has been giving the illusion of strength should also break below the Nov 08 lows, before all said and done.
Now here's the question that's bothering me. Why did we not even get a bounce into the 9 month cycle crest ? Did the crest come early ? Did we severely left translate ? If so, we could be seeing something like the action in 2002 where we got a July bottom. Now with the current breakdown, this becomes mostly an academic question. It really does not matter anymore whether SPX produces a sharp bounce into the 9 month top or not. The risk of a bounce should be handled with stops, in case it does materialize. If the move into the cycle crest was this bad, then what would be the scenario going into the 9 month cycle bottom in fall ? This market structure is very bearish and i am not sure what will/can turn it around.
Sorry, i don't have anything useful to say here, other than i am bearish and will continue to short bounces and cover oversold. That is, until some new information flows into the market.
Monday, February 23, 2009
Setup invalidated
The Setup for a ST bottom from Friday got invalidated today, with the NYSE and Nasdaq MCOs cracking the Nov 08 lows. So price should follow. Back to shorting rallies mode.
Friday, February 20, 2009
ST Bottom ?
I think so ! But that's just my opinion. The daily and the hourly trends are still down.
Since i called the Jan top, a day after it topped, i have been consistently bearish and have been calling for the retest/break of NOV lows. I did not find any trades on the long side worth playing from a swing perspective and so never played them.
Now today, based on my technicals and the way i view them, i would call the retest of Nov 08 lows complete, which i have been pounding the table for weeks. Now how the restest happened, gives me clues as to whether the Nov 08 lows will hold or break. Firstly it has not been an impulsive downtrend from the Jan highs, rather a torturous sideways to down trend. It was a struggle all the way down. We have not broken any of the NYSE MCO divergent lows so far, despite the DOW already having made a low and SPX coming close to it today. The VIX today peirced above the upper daily BB and closed below it. The P/C ratio again which pierced above the upper BB and closed below it. The volume on SPX was climactic. With such humongous volume one would have expected a wide range bar on the daily which did not occur. So someone clearly was absorbing all that volume. The NDX touched the lower BB on daily and smartly reversed. Now why didn't the VIX explode? Are the options folks stupid ? These are subtle clues. They never ring a bell at the top or bottom. Did they during the Jan top. How many really beleived that we would test the Nov lows back then ?
On the sentiment front, from a subjective viewpoint, what i have been seeing on the web is extreme bearishness. What i found rather interesting is many folks are now using the catchphrase "The trend is down !". That bravado at the bottom, when the SPX hit the 3-sigma lower band on the daily and the lower BB on weekly ?? That kind of bravado rarely plays off. The trend traders would be biting their nails in anxiety at these junctures or taking partial profits at the very least.
All this to me says that it was a wave B or wave x, with a wave C about to commence to the upside. That is also consistent with the 9 month cycle cresting sometime in March.

I normally don't comment on the VST stuff on this blog. But i could not help noticing the divergent low on the hourly and turn up. The 10-min charts gave a continuation buy, suggesting a gap-up on Monday. If we gap-up above 780 on Monday, that would also constitute an island reversal and would also produce a hourly buy signal. There are many big IFs at this point, which should all be resolved Monday morning.

Dollar and Gold
Looks like the dollar index topped out today for the ST. This would mean a trip back to the 78 levels again. I think GOLD will also commence a downtrip along with the dollar. I am still an IT bull on the dollar and think it will hit 100 sometime this year.
Good luck !
Tuesday, February 17, 2009
Heading into the 9 month crest
In my Feb 7 update,i wrote,
From a ST timing perspective (daily charts), the current momentum has about 2-3 days of rally power left. If that rally tags SPX 880-900 area, i will be looking to short that area. Or if we breakdown from here and take out SPX 840, then i will be shorting into weakness.
We topped 2 trading days after my update. Now we have broken SPX 800. On one hand while that looks bearish, on the other hand we have the 9 month cycle heading into the crest. So it's not going to be a straight-down kind of an affair here, i am afraid. Rather i would expect some kind of a sharp bounce here, another bear-flush-out rally, as we head into the 9 month cycle top, which i am expecting around mid-March. I still beleive that this top would hold below the Jan 09 highs.
Once the 9 month cycle crests, then it's down all the way into the fall. Cyclicaly and from structural perspective, not to memntion the trend, the market looks very bearish heading into the fall this year. Trade safe.
Bottomline, i am expecting some kind of a sharp bounce here over the next 1-2 weeks before the big kahuna bear resumes with full force. VST bullish. ST - IT bearish.
Happy Trading !
Saturday, February 07, 2009
IT Update and the upcoming 9 month cycle top
This week's action was mildy surprising to me from a ST timing standpoint. I did not expect this bounce. Or to put it differently, i did not expect this size a bounce. I had thought we were consolidating between SPX 810-840 on the hourly charts. The breakout above 840 came as a surprise to me.
This is called trend trading hell !. The hourly starts uptrending. You look for a pullback to enter long and the pullback goes so deep that it starts downtrending. Then you look for a bounce to short and then the bounce goes so higher that it starts uptrending. Rangebound traders rule this kind of market.
Now the SPX hourly has started uptrending. But the daily charts of most indices SPX, DOW, RUT and the XLF are all downtrending, with the exception of NDX which is uptrending.
Now here's the dilemma. If you beleive a new upleg on SPX has started, then you look for the next pullback on hourly to buy on the SPX. If you have faith in the daily downtrend on SPX, you short the next overbought condition on SPX. Now which one is safe ? Looking at this bear market over the last one year, shorting hourly overbought has been more rewarding then trying to buy the pullback on hourly. Again, the next pullback on hourly, if it falls below 840, then the hourly uptrend is history.
This looney sideways chop can go for another 3-4 weeks wearing out most traders trying to trade the trend, which is down. The reason being that Nov was the 9 month cycle bottom in my work and the next 9 month cycle cresting would come in the late Feb to early March period. Now the downtrend is fighting against this upcycle which is moving into it's crest, which is producing a sideways trendless market. Until the 9 month crests, this sideways cause building can continue, before another large collapse. I still beleive that the 9 month cycle top will be a secondary top below 1/7/09 on SPX.
From a ST timing perspective (daily charts), the current momentum has about 2-3 days of rally power left. If that rally tags SPX 880-900 area, i will be looking to short that area. Or if we breakdown from here and take out SPX 840, then i will be shorting into weakness.
GOLD
One of the commnets on my blog last week was from Greenie as to how Gold is rallying in the face of a deflation. I disagree. Gold is not rallying, but is in a large sideways consoldiation on the weekly charts. Well Gold is certainly not collapsing as it would in a traditional deflation. Because, it knows that the morons controlling our financial destinies will start monetizing this mountain load of debt. This will surely happen at the bottom of the deflation when desperation will overrule sane thinking. Then i think, GOLD will have one of the biggest rallies of our lifetimes !. I also think we will witness the greatest bloodbath in the U.S treasuries, when the monetization starts in earnest. Gold is topping both in the ST and IT and should make a trip below 700 area again based on my work. Dollar index is headed to 100 in the IT.
Good luck !
Friday, January 30, 2009
IT Update
In my last update on Jan 9, i had said that we would visit the 850 area and then i will reevaluate the next course of action depending on the price action near the 850 area.
We tagged the 850 area and after a brief consolidation between 810-850, much to my surprise we broke out above the horizontal consolidation, pushing the hourly trend up, while the daily still remained on a sell. And we gave back all that gains in two days pushing us back into the horizontal channel, confirming a failed breakout. Now everything is back in harmony - hourly, daily and weekly are all down. So to keep it simple, the next bounce on the hourly is a short.
The raging discussion these days is the amount of sideline money that will start a rally from hell !. Well if there was so much sideline money, what's this distress in the global economy we are talking about ? Why this drastic slowdown in consumer spending ? Why these massive foreclosures ? Maybe all these problems are related to the sub-prime of the society - the poor suckers. There must a section of the society totally unaffected by all these, waiting with of wad of sideline cash to throw into the value that this market has created. Bring it on - we need ya !
From the book The Plungers and the Peacocks
During the 30s
There was this businessman who was highly profitable during the boom. Several months before the crash, he had the intuition to get out. Even after the 1929 break, when his stock had fallen to ridiculous levels, this man still felt its price was too high and refused to nibble. But then, it tumbled to the point where it was providing an 8 perecent yield and he bought a heavy block of it. He refused to have any truck with margin operations. The price continued to slide and the stock skidded to a level where it was yielding 12 percent. Then, and only then, did our man think to take on another big block of stock. The stock continued to fall and twelve months later it was yielding 20 percent. Having no more margin to put up, he was sold out by his bankers.
Such is the reality of value investing in major bear markets. Now let the value buyers chase the market all the way down. I will keep repeating this. We have broken the cycle degree channel from the 70s. A cycle degree bear market will not leave a section of the society unaffected, creating a value buying opportunity for miilions. Rarely does a secular bull start with millions riding on its back. There's just no wall of worry for a bull to start here. There's only hope - like the TARP, the bailouts, Obama, Fed, Bad bank, sideline money et al.
This is not an investment environment, but a trading enviroment. As for trading, there's nothing much to say - short the next bounce on the hourly.
Good luck trading !
Friday, January 09, 2009
2009
LT update
Like the Zen philosophers say
"Sitting quietly, doing nothing, spring comes, and the grass grows by itself"
A sustainable LT bottom will take time and the cycle needs to run it's course and then a new bull would start by itself. We don't need no stinking beaurocrats or politicians to do that job for us. The first signs of a LT bottom will become apparent on the weekly charts and weekly indicators. I will keep updating my LT indicator every few months to see where we stand. In my last post, i showed that we were nowhere close to a LT bottom, let alone a IT bottom.
All those folks who have been spared of last years massacre, have started asking again as to what's the best area in the stock market to put their money to work. A cycle degree bear market woudn't leave a section of the society unaffected, letting them catch the bottom of the bear market without pain. In other words, the next cycle degree bull will not carry a few million value investors, wannabe Warren Buffets on it's back. Most of these value investors will be financially and psychologically destroyed before the next major cycle degree bull begins. Investing and trading interest will dwindle to zero as has been the case with all other cycle degree bear markets. I really have no clue at this point whether we will simply zig-zag down or we do a large consolidation around the 700-1000 levels in 2009. It would be pure speculation. But one thing is writen on the wall. 2008 was the worst year in many decades for the stock market. 2009 will go down as the worst year for the economy, of the last many decades. Paying bills will take precedence over buying stocks. Cash will remain the best investment IMO until this deflation cycle runs it's course.
IT update
Before i left for my vacation, i said that a minor low was in place and we should see some sort of rally on the daily charts. And we got that minor rally to the SPX 940 area.
To save a few keystrokes, i wrote this on traders-talk 3 days back
I have many reasons here to beleive that we would fail on the daily charts i.e see a strong rejection on the daily charts. I can state them, but it's putting the cart ahead of the horse. We peirced the upper BB on the daily over the last two days, but closed below it. Now in a bull market, the next logical step would have been that the BB would have adapted to the rising prices and flared up. But this is still a bear market by all measures and the logical resolution would be a rejection from this general area with the upper BB acting as resistance. Looking at the MCOs, phenomenal amount of money has been thrown at the markets in the last 30 days against the intermediate trend. But with all that ammo, the power of the rally in terms of price momentum has not even been half of that 12 day decline from 11/5 top. We'll see...
Now we got the rejection off the upper BB on the daily charts. I have some VST projections to SPX 850 area and if that does not hold then a trip to retest the Nov lows or a breakdown below it will be in order. We are on a swing sell here. I will evaluate again, once we reach the 850 area.
The NYSE MCO superpike has been the discussion in many TA forums. I am still of the opinion that it was good money thrown after bad. All the money that flowed into the markets were thrown against the intermediate trend, with the hope of turning the intermediate trend. In a bull market the MCO spike is a precursor to the rally to follow, as that additional money flow would only accelerate/continue the uptrend. In a bear market, it would at best neutralize the downside damage. Like a scuba diver reaching neutral bouyancy, using a combination of his weight belt and BCD, this market will achieve it's neutral bouyancy sometime in the coming months. That should be apparent in the weekly divergences. If and when that happens, i will respect any spikes in the MCO. I am still waiting for that.
Good luck everyone.
Monday, December 08, 2008
LT update - Dec 8, 2008

In my Last update on Oct 10,2008 i said we would break the Oct 02 lows marginally and start a bear market rally.
It's been a while since i posted my LT indicator. Just thought i will update where we are, to add a little bit perspective to many LT bottom calling that are happening on the web with little to nothing technical evidence to support their calls. There's also a lot of discussions going on as to how we are almost close to a bottom similar to 2003. Nothing is further from truth (technically speaking) as the charts speak for themselves. Look at the massive base building that occurred near the 2003 lows with some nice divergences on my LT indicator.
This indicator called the onset of bear Sep 2000, onset of bull in June 2003 and onset of bear in Jan 2008. Again this is not an IT indicator, but a LT indicator. So one is bound to miss the bottom 10-15% of the rally, if confirmation is needed from this indicator. But if one is playing the LT, why the uncontrollable anxiety of missing the bottom 15%, on what would turn out to be a multi-year rally, i ask ?
One look at the indicator says, where we are now and what is required to create LT divergences on this indicator and how long would it take to build such a long lasting bottom. Any serious technician worth his salt can make some educated guesses on that.
As for the ST, today's action took out the prior swing high on the daily charts at SPX 916. So that confirms that a minor low is in place on the daily charts. That does not mean one can go and buy the strength here, like one would have done in bull markets when the monthly, weekly, daily are all uptrending. In a bull market, if you err on the daily, the weekly trend would bail you out. If you err on the weekly, the monthly would bail you out. Currently with only the daily uptrending, if you err on the daily, you would get killed by the weekly. In other words, at this point, one has the latitude to err only on the hourly charts and get bailed out by the daily. That to me, means, wait for the next hourly oversold condition with divergences and hop in on the rally until it exhausts itself. If the next hourly oversold comes near the prior lows or below that, too bad ! :-). Looking at the NYSE MCO itself, the bulls have probably used up all their ammo already. We'll see...
As for the economy, things should only start downhill from here. The worst of the economic conditions is always past the stock market lows. This whole infrastructure spending is nothing more than another crappy measure by the government IMO. Mimicking the bygone era solutions to new age problems only shows the lack of ingenuity. Moreover, if one believes that infrastructure spending got us out the Great Depression, then yes, i would also believe that Al Gore invented the internet. The cycle needs to run it course. Until then all this government spending and bailouts is throwing good money after bad, throwing precious liquidity into inefficient goverment enterprises. Sorry, i keep forgetting, capitalism as we knew is dead.
Enjoy the rally. I will be back next year after my holidays.
Friday, October 10, 2008
LT - Higher degree trend change !
Last week i warned of a higher degree change, if SPX 1040 was cracked. The first warning shots of a higher degree trend change were fired when SPX cracked 1170, the wave 4 support of the impulse from 2002-2007. If 2002-2207 was a cycle degree advance, we should not have seen the SPX 1170 broken on a weekly closing basis and a strong rally should have emerged from that point. The last technical projection was 1040 as i posted last week and it's a virtual air pocket from there with no support until Oct 2002 lows. So the market action is loudly saying that this is longer a primary degree decline but a higher CYCLE degree decline and Oct 02 lows will be taken out by the time this bear market ends. So a CYCLE degree wave 4 is in progress at this point unless proven otherwise.
Click on the chart to enlarge it

A little bit of history and perspective. This is all again of no trading value and is of only academic and intellectual interest. If you are not interested in that, please skip the following section.
There were calls that 2000 ended a secular bull market. Nothing could be further from truth. The only sector which made a secular top in 2000 was the tech. Most other major and minor indices took out the 2000 top after the bull started from 2003, some marginally and some by a large extent. Fortunes were made in virtually every sector of the market globally, while the permabears were crying bear market rally for 5 years. While the term secular can be subjectively intrepreted, e-wave does not allow that luxury. It's hard to categorize a top as secular when more than 80% of the sectors make their lifetime highs.
The advance out of 2002 mean't two things
1) A major cycle degree advance has begun from 2003, which is what i beleived.
2) The primary degree wave 5 of CYCLE III was in progress.
In hindsight, it is now apparent that 2) was correct and we were concluding the large secular advance from 1975. The 2002 lows never broke the CYCLE degree channel from 1975, leaving the CYCLE degree advance intact. We have now broken that CYCLE degree channel, which means 2007 marks the CYCLE wave III top and a CYCLE wave IV is now in progress. The LT support for CYCLE wave IV should come near the lower degree wave 4 (primary degree wave 4 of CYCLE III) which is the Oct 02 lows. We will probably undershoot the Oct 02 slighly before the bear is over.
This is a chart i posted on my blog a few years back. Given that this bear has progressed to a higher degree, i will have to make a structural adjustment by moving the CYCLE III top from 2000 to 2007.
Very LT count
Click on the chart to enlarge it
Since this is a CYCLE degree bear market as opposed to the Super Cycle degree bear of 1929, the economic conditions during this decline will be no where as worse as 1929. We are dealing with a wave of degree less than 1929. Nevertheless it's going to be tough times for the next few years. Cash will be king. A major value buying opportunity will arise in the months and years ahead, but irony of every major bear lows is that folks will be scrambling to find money for their next meal and buying stocks will be the least of their worries/priority, when it presents itself. Stay defensive !
Once again, wild projections like DOW 4000 and DOW 400 are getting thrown around. It doesn't cost money to make such wild projections. Can it get there ? Who knows ? But do we have technical projections for that ?. Nope !. To come with LT downside projections, we need a intermediate term multi-month rally here, which fails on an intermediate term basis. Right now we are in a free fall with no bottom in sight. The bottom could come anyday, between here and SPX 700, after which a intermediate degree bear market rally should begin. VXO hit 100+ and the volatiltity is insane. Trade Safe ! Good luck.
Click on the chart to enlarge it

A little bit of history and perspective. This is all again of no trading value and is of only academic and intellectual interest. If you are not interested in that, please skip the following section.
There were calls that 2000 ended a secular bull market. Nothing could be further from truth. The only sector which made a secular top in 2000 was the tech. Most other major and minor indices took out the 2000 top after the bull started from 2003, some marginally and some by a large extent. Fortunes were made in virtually every sector of the market globally, while the permabears were crying bear market rally for 5 years. While the term secular can be subjectively intrepreted, e-wave does not allow that luxury. It's hard to categorize a top as secular when more than 80% of the sectors make their lifetime highs.
The advance out of 2002 mean't two things
1) A major cycle degree advance has begun from 2003, which is what i beleived.
2) The primary degree wave 5 of CYCLE III was in progress.
In hindsight, it is now apparent that 2) was correct and we were concluding the large secular advance from 1975. The 2002 lows never broke the CYCLE degree channel from 1975, leaving the CYCLE degree advance intact. We have now broken that CYCLE degree channel, which means 2007 marks the CYCLE wave III top and a CYCLE wave IV is now in progress. The LT support for CYCLE wave IV should come near the lower degree wave 4 (primary degree wave 4 of CYCLE III) which is the Oct 02 lows. We will probably undershoot the Oct 02 slighly before the bear is over.
This is a chart i posted on my blog a few years back. Given that this bear has progressed to a higher degree, i will have to make a structural adjustment by moving the CYCLE III top from 2000 to 2007.
Very LT count
Click on the chart to enlarge it
Since this is a CYCLE degree bear market as opposed to the Super Cycle degree bear of 1929, the economic conditions during this decline will be no where as worse as 1929. We are dealing with a wave of degree less than 1929. Nevertheless it's going to be tough times for the next few years. Cash will be king. A major value buying opportunity will arise in the months and years ahead, but irony of every major bear lows is that folks will be scrambling to find money for their next meal and buying stocks will be the least of their worries/priority, when it presents itself. Stay defensive !
Once again, wild projections like DOW 4000 and DOW 400 are getting thrown around. It doesn't cost money to make such wild projections. Can it get there ? Who knows ? But do we have technical projections for that ?. Nope !. To come with LT downside projections, we need a intermediate term multi-month rally here, which fails on an intermediate term basis. Right now we are in a free fall with no bottom in sight. The bottom could come anyday, between here and SPX 700, after which a intermediate degree bear market rally should begin. VXO hit 100+ and the volatiltity is insane. Trade Safe ! Good luck.
Sunday, October 05, 2008
IT/LT update - 10/5/2009
I was completely wrong in assuming that a major wave A had ended and wave B had begun. That cancels all my upside projections for now. 9/18 bottom was as good as it gets. Horrible sentiment. A violent price move out of that. A kickoff move on the NYSE Vol osc. And the price finding support a LT wave 4 support and a technical measured move. But none of this was sufficient for this vicious bear. I was expecting a 50% retrace of the 9/18-9/19 move and a rally after that. I was cleary proved wrong.
It's very concerning that the market failed to hold at the previous wave 4. It's very concerning that the market did not hold the double top measured move projection to 1170. It's also very concerning that weekly candle hammer was reversed with even more violence.
Now given that the double top projection to 1170 did not hold, the next measured move projection comes from the (2/1, 5/19) double top, although not a perfect double top. Depending on whether you use 2/1 or 5/19 for the projection, we get two targets - 1040 and 1070. If 1040 does not hold, then there are no further technical projections at this point in my work. That to me would mean a larger degree trend change may be in works. Too early for me to jump the gun on that and make bold sorry projections. Just to give a clue on how overextended the market is here, look at the weekly bollinger bands. Price close way below the weekly BBs and failed to mount a reversal out of it. In the last 10 years we have seen two instances where this kind of configuration presented itself - the week after 9/11 and July 2002.

Bottomline, i will be watching SPX 1040 with interest for clues on possible larger degree trend change. For now my wave count remains the same, except that the intermediate wave that i thought bottomed on 9/19, continues to extend.
P.S - BTW, i closed my SPY positions that i opened last week for 60 points gain, which i posted on traders-talk, since i think we are at the crossroads of a possible trend change of higher degree.
Good luck !
It's very concerning that the market failed to hold at the previous wave 4. It's very concerning that the market did not hold the double top measured move projection to 1170. It's also very concerning that weekly candle hammer was reversed with even more violence.
Now given that the double top projection to 1170 did not hold, the next measured move projection comes from the (2/1, 5/19) double top, although not a perfect double top. Depending on whether you use 2/1 or 5/19 for the projection, we get two targets - 1040 and 1070. If 1040 does not hold, then there are no further technical projections at this point in my work. That to me would mean a larger degree trend change may be in works. Too early for me to jump the gun on that and make bold sorry projections. Just to give a clue on how overextended the market is here, look at the weekly bollinger bands. Price close way below the weekly BBs and failed to mount a reversal out of it. In the last 10 years we have seen two instances where this kind of configuration presented itself - the week after 9/11 and July 2002.
Bottomline, i will be watching SPX 1040 with interest for clues on possible larger degree trend change. For now my wave count remains the same, except that the intermediate wave that i thought bottomed on 9/19, continues to extend.
P.S - BTW, i closed my SPY positions that i opened last week for 60 points gain, which i posted on traders-talk, since i think we are at the crossroads of a possible trend change of higher degree.
Good luck !
Monday, September 29, 2008
Da plan
The market action today clearly proved me wrong. Period !
Now the question is how do i exploit this opportunity. I don't trade when VIX is above 40, which is currently around 48. My trading account is fully in cash.
But this is a great time for investment or so i think. I bought a 25% position in my retirement account around SPX 1115. Will buy another 25% if we go down to SPX 1015, which is a big "IF". That would put my average position around 1165, with a stop around 950. A 10% stop. In the worst case, my investment losses would be around 5%, if i get stopped out.
That's da plan. I am in 25%. Let's see how this goes.
Saturday, September 27, 2008
IT/LT bottom update
I posted last week that we made a LT/IT bottom and a multi-month rally lasting 6-8 months should begin. Many are still calling for Oct lows. I will have to respectfully disagree with them. What we saw was historical off-the-chart volume at the lows. It just blows my mind ! Then looking at the NYSE vol MCO, we had a kick off move on the MCO off the lows. That combined with the price action out of the bottom says in no uncertain terms, that we have put in a major bottom here. Now if we go up and take out SPX 1265, that would be the confirmation that a new uptrend has started. The kickoff move out of this bottom has been bigger, faster and violent than of 1/23, 3/17 or 7/08. That means we are starting a wave which is "higher in degree" than any of those waves that emerged out of 1/23, 3/17 or 7/08. Consequently the time and size of this wave should also be bigger than any of those ST moves. I posted the projections for this wave B in my previous post and i see no change to that.


Now as for the sentiment, this is by far the worse LT sentiment that i can recall in a while. The news of death of America is once again exaggerated. As i said last week, the asian regional newspaper journalists who think Freddie Mac is a hambuger, also have realized the impending death of America. When you get historical volume and a kickoff move on the NYSE Vol Osc out of this kind of extreme sentiment, it can only be a major IT/LT bottom. Time will tell...


Now as for the sentiment, this is by far the worse LT sentiment that i can recall in a while. The news of death of America is once again exaggerated. As i said last week, the asian regional newspaper journalists who think Freddie Mac is a hambuger, also have realized the impending death of America. When you get historical volume and a kickoff move on the NYSE Vol Osc out of this kind of extreme sentiment, it can only be a major IT/LT bottom. Time will tell...
Saturday, September 20, 2008
LT Update - Voila !
On Aug 23, i wrote that we would head into a major 9 month cycle bottom and we did. On Sep 15, i posted that we should end the climactic phase in about 1-2 days. In my Sep 17 post i said that Sentiment was ripe for a major bottom and the pattern,price and time was ripe. Now one could blame the bottom on the Fed/Treas intervention etc. Yes, but that's not technical analysis. Hasn't the Fed treasury been intervening constantly over the last few weeks. Why did the market choose to bottom on a particular day ? Well, if one is a technical analyst, it would have been hard to miss this bottom. 2 days prior to the bottom we had nasty breadth plurality, with decliners exceeding 3000+ on the NYSE. During Thursday morning trade, the advancers were running around 2000, while the market started to plunge. Decliners never went above 2000 during the selloff. Not to mention the capitulation volume over the last few days. Tell tale signs of an approaching bottom. Of course, the advance out of the bottom got exaggerated with the annoucement of the short selling ban. But point is, if you are TA guy, you would have been prepared for this assault. That's what i had been preparing for, with my posts over the last few days on this blog. Many are calling this as a ST bottom. But i disagree and i am going out on a limb and calling this a major IT bottom. A multi-month rally lasting 6-8 months should begin from here.
My LT projection for SPX was 1170+/- 20 points and we acheived that this week. The market progressed pretty much in the way the pattern was projected. An a-b-c-x-a-b-c.
Prior LT projection
Given that this was the largest, fastest 1-week rally since the bear market begun in Oct 2007, the post market action out of the bottom loudly says that the first leg of the bear market is likely over !.

Now to the fun part on the projections. Assuming wave A is over, Wave B typically retrace 50-78.1% of the wave A rally. Given the fast nature of the rally out of the bottom, and relative to where the price now is w.r.t to the weekly Oscillator, there's ways to go before the weekly charts get overbought. So it's unlikely that the 50% retrace will mark the end of the wave B rally. Timewise it took almost 12 months for the wave A rally. So the wave B rally should last at least for 6-8 months. Given the time requirement and the room on the weekly momentum charts, i would say the target for this Wave B rally should be at least the 61.8% retrace, which comes around 1407. That's my prelimnary projection P1. If we exceed and hold above that, we could tag the P2 target (1470), which is quite remote, but nevertheless possible.
The necessary divergence on the NYSE MCO is in place. The necessary momentum divergences on the weekly charts are in place. I dont' see a case for a retest. I only pray that the bears don't get caught in another gap-up over the weekend. A lot of psychological damage has been made on the bears in the last 2 days. The outrage over the govt intervention and disbeleif in the rally, will ensure that the bus will never get loaded on this upleg. Keep an open mind and trade well ! Good luck.
Wednesday, September 17, 2008
Sentiment
Sentiment here is appropriate for a major bottom (no i am not talking about a ST bottom). What a contrast ? It was just 8 months ago when the chinese housewives were buying the Shanghai with both their hands and the Indian housewives went nuts, all plunging into the Reliance IPO when BSE was at 21000.
When S&P cracked 1380 back in January, i posted the LT sell on the S&P with a target of 1170+/-20. There were no talks about the implications of the U.S market breakdown. It was all about how the emerging markets were immune from the U.S developments. BSE was at 20,000+ and SSEC was somewhere around 5500 then. Now that the BSE is close to it's LT objective of 12300 and Shanghai now below 2000, stories about the death of U.S is appearing on the front pages of the asian newspapers, written by journalists who think AIG is an index and S&P a stock ! And mind you, the stories are appearing even on the asain regional newspaper frontpages !
Time to get bearish was 2 weeks back when the trend turned. At the tops and the middle of the trend, there are plenty of trendlines, forks, bollinger bands, fibonanci, pivots, etc to provide support and a slope to slip down on. When all supports are broken and there's nothing to hang on, then the raw fear takes over, like now. The crash topics take center stage. Newsletter writers warn their subscribers of the dangerous volatility and ask them to stay in cash (and you need to pay these newsletters folks to learn to stay in cash. Amazing !). Folks, it's nothing new here. I bet every major IT bottom has felt that way. Most typical of a 9 month cycle bottom.
Now this is neither an advise to bottom pick nor a passage about my knife-catching abilities. Just a sentiment read. I don't trade these bottoms. I am just not interested. I just scalp the volatility, beacuse unless one has the ability to take 50-100 SPX points drawdowns calmly, they have no business trying to establish positions here.
Time, Pattern and Price are ripe here for the completion of the first leg of the bear market. Now let the market speak....
Monday, September 15, 2008
9 month cycle update
Since my Aug 23 update, the market has been severely pressured by the 9 month cycle. Given that the cycle is on track, i would expect the lows to come sometime the end of September. Negative breadth climaxed on today's selloff and the volume rose as we broke SPX 1200. We are entering into the selling climax phase of this decline, which should last a couple of days, which means some nasty volatility and wide range bar days. I still expect the market to bottom in my LT bottom projection area of SPX 1170+/- 20 points. If the market puts in the internal bottom in the next couple of days, then we should see a bounce and retest towards the end of this month. That's just a guess at this point. Until the daily trend turns up, think shorting the bounces, not picking some elusive bottoms. Supports mean squat in strongly downtrending markets ! It's "Slipping down the slope of hope". It's gonna be one hectic week. Will post an update, end of this week.
Good luck !
Good luck !
Saturday, August 23, 2008
9 month cycle bottom
I am not a cycles guy and i don't watch short-term cycles. But i do pay attention to the 40 week-cycle, i.e the 9 month cycle. One of the most powerful and reliable cycles IMO.

Ideally the cycle is due the end of Septempber. If it right translates, the way it did the last time, then it's due end of Oct to first week of Nov.
There are wide range of opinions concerning the LT scenario. Opinions range from a dark bear breaking the Oct 02 lows to a LT bull which has already resumed. Some remain in the middle camp which are calling for a cyclical bear. I continue to remain in the middle camp i.e a primary degree wave 2 from the Oct 07 top (Wave 1 being the primary 1 from oct 02 - oct 07).
The coming 9 cycle bottom would give more clues about the intermediate picture. Ideally we should break below SPX 1200 and put the necessary divergences on the weekly to end the primary degree wave A of 2 and start the primary degree wave B of 2.
On the other hand, if the 9 month cycle lows hold above SPX 1200, then it would mean that the primary degree wave A of 2 terminated at SPX 1200 and we are already in a primary degree wave B.
The coming 9 month bottom will provide strong clues about the IT scenario and put to rest all opinions, as the market will once again assert itself, leaving behind all opinions in the dust !
Wednesday, August 20, 2008
Weekly Trends - Aug 20, 08
Gold and Dollar - My call on July 27 was spot on. Gold plunged below $800 and Dollar tagged the 77-78 area. Now Gold and Dollar are at key LT pivot points. If the bull market in Gold is alive we should start a screaming rally and take out the March 08 highs. That would be the expectation of a trend follower. However, given the concerted co-ordinated efforts among the central banks across the world to combat inflation (many of the asian bloc countries already in a run-away inflation mode), it's possible that the inflation cycle has peaked and so has the commodity bull cycle. That's just my opinion. I will let the market speak for itself.
SPX
Nothing has changed since my July 21 update. We were at 1260 then and we are around the same levels today. SPX probably topped at 1313. If not, there are two key resitances overhead - 1327, which is the May 06 highs and the 200 SMA, currently around 1365. 1365 also happens to be a key horizontal res (March 07 and Aug 07) bottoms.

As far as the daily charts goes, it's a tough choppy market to trade here. It's the hourly charts where the action is. How do i play this? To me, it's simple. Currently the daily momentum is down. So keep shorting the bounces on the hourly charts. If the daily momentum turns up, keep buying the dips until either 1327 or 1365 is reached.
Good luck.
Sunday, July 27, 2008
Weekly trends
SPX - I presented two counts in my LT update last week, one in pink and other in blue. Both the counts are equally probable at this stage. There's not enough information to rule out either scenarios at this stage. A retest of SPX 1200 with either a higher or lower lows with divergence (count in blue) would be intermediate term bullish. If the count in pink materializes, then we should rally to about SPX 1335-40, before the next downleg starts.
Dollar, Gold - The weekly trend on the Gold remains up and the Dollar down. I got a countertrend sell on Gold and coutertrend buy on Dollar on the weekly charts, end of this week. Dollar index should rally to about 77-78 before it peters out. In the meantime Gold should drop to about $800, before the next weekly uptrend starts.
Dollar, Gold - The weekly trend on the Gold remains up and the Dollar down. I got a countertrend sell on Gold and coutertrend buy on Dollar on the weekly charts, end of this week. Dollar index should rally to about 77-78 before it peters out. In the meantime Gold should drop to about $800, before the next weekly uptrend starts.
Subscribe to:
Posts (Atom)
