I think this market has been as crummy as i have seen in a while with no conviction to move either way.
Anyway with all the excitement that we saw today, my system never went to a buy. NDX remains on a daily sell. SPX which has been relatively stronger than NDX, which was close to making new highs coudn't generate a buy signal. Worse among the lot, DOW made new highs today and still remains on a daily momentum sell (I think this is as crazy as it gets). NQ might double top around 1752 area. But that's about it for that sucker. I don't think NDX will make new swing highs in this swing. Call me a skeptic. The odds favour some downside fireworks starting anytime here. The bottom pickers got their azz saved today - thanks to Fed obesssed programs !. All the technicals i watch, says down. If the markets trumps all those technicals, i won't fight it, but won't be obsessed with it either.
Thursday, April 27, 2006
Monday, April 24, 2006
SPX sell signal at close today
As you might recall, i posted this a couple of days back.
Now if the DOW starts correcting here, it would push the SPX CCI below 100 and NDX will seem like a rejection from the 100 line. So the implication is that some sort of a short term correction will begin soon. If this scenario were to transpire, it won't be a plain garden variety ST correction. The reason being the daily MACD is already hovering near zero and if we were to get a continuation sell on the MACD, the MACD would dip below the zero line. Selloffs when the MACD is below the zero line are generally brutal.
The post market action seems to confirm my above anaysis.
My system issued a daily sell signal on SPX at close today. I am expecting a sharp selloff over the next few days. The NYSE MCO had a zero line reject today. This market has been pushing against internal divergences. The sentiment seems to be one of "Divergences don't matter anymore". I think the market is about to give a surprise to the bulls here.
Just one look at this tells all
http://stockcharts.com/gallery/?$NYAD
Good trading to all !
Thursday, April 20, 2006
Why i am not too excited about the upside here ?
Some simple intermarket analysis. Daily CCI(14) on DOW is around 199, SPX is 129 and NDX is around 90.
DOW is already at extremes which implies some sort of correction to kick in on the DOW. Now if the NDX and SPX starts moving higher along with the DOW, DOW CCI would reach very extreme territory and will end up as a blowoff move. Not very exciting if one is positioning for a swing move on the long side, cuz the reversals from the blowoffs could be swift. Look at what happened to GOLD and SILVER today !
Now if the DOW starts correcting here, it would push the SPX CCI below 100 and NDX will seem like a rejection from the 100 line. So the implication is that some sort of a short term correction will begin soon. If this scenario were to transpire, it won't be a plain garden variety ST correction. The reason being the daily MACD is already hovering near zero and if we were to get a continuation sell on the MACD, the MACD would dip below the zero line. Selloffs when the MACD is below the zero line are generally brutal.
So my strategy at this point would be to daytrade the hourly until either one of the scenario transpires and then take a swing short position once my system issues a sell.
Wednesday, April 19, 2006
Commodity complex on fire !


The entire commodity complex and the 10-year yields are on fire. If one thinks that the Fed is done, as portrayed by the media, i think they must be smoking something really heavanly. I think a 50bp hike in May is now becoming more of a reality, if this commodity meltup is to be contained. Now if the stock market were to discount that hike before that actaully happens, then we should see a serious drop in the markets before the Fed meeting. At least, that's the conceptual framework from which i am operating. Now whether that drop comes from higher levels or right from here is not clear at this point. The daily momentum indicators are still on a momentum buy. I am still waiting for a sell signal from my system. Until i get that signal, i will avoid swing trading and continue to trade the hourly charts in both directions. In the VST though, i expect a gap-down tommorow morning and a swift selloff. And then the OPEX circus should continue for the next 2 days. Overall i am bearish now and i expect the NYSE summation index to make a trip to the zero line or undershoot it, while the NYSE MCO puts in a divergent bottom, before any meaningful rally resumes.
Tuesday, April 18, 2006
Extreme to Extreme to Extreme...
This market is simply not playable from a swing trading perspective. The only way to play this market is either daytrade of if one is swing trading, blindly pick the extremes with the hope of getting it right. If one waits for a technical confirmation of any sort, then the move is over by then. To illustrate a case in point, the momentum flipped to a sell on 4/11 and that was the day the daily CCI(20) hit -255. Do you go short then ? I think one would have been obliterated if they played leverage and went went short on that day. That's one of the reasons i turned neutral on that day. Every momentum buy on my indicators is not a buy signal or every momentum sell is not a sell signal on my system. I have rules to determine what is a valid buy/sell signal.
As i said on April 11 on this blog
In any case, this is the land of quick or dead. Long and shorts are equally dangerous. With this kind of CCI configuration, we could easily see a 20 point short squeeze or a 30-40 drop kind of moves in a day.
While in hindsight, it always looks easy and one could say, "i could have gone long yesterday with tight stops and caught this move". The cycle folks have been expecting this 5 week bottom since the last week. So one could have gone long a few times in the last week and got stopped out multiple time, unless one does not use stops. Two of my indicators flipped to long today, while one more indicator did not. In other words, i still don't have a buy signal despite the obsence move today. By the time i get confirmation, this move could be over.
The daily CCI has moved from +226 (Extreme) on 3/16 to -255 (Super Extreme) on 4/11 on now is gunning for another extreme, perhaps. If this market corrects back and puts in a constructive bottom, that would be the time to go long for a swing trading long. On the other hand if we blowoff here and put another CCI extreme, that would be a constructive top to go short from. Right now we are technically still in the land of "Quick or dead". So my system remains neutral with no signal at this point as we are stuck in this zone of high risk.
The reason for the market rally as the media potrayed was the FED minutes which hinted at the rate hike campaign nearing an end. That's pure garbage. The economy is operating at full capacity at full employment levels and the liquidty is still sloshing around the globe at unprecedented levels. When the FED met the last time GOLD was not at 620 nor was silver or copper or OIL, which are all at crazy heights. The commodity markets are just going nuts. The situation has clearly changed, dramatically so from the last Fed meeting. So to assign any value to the last FED meeting minutes is meaningless. The FED rate hike campaign has been eerily simlar to 1999-2000. After a series of 25 bp hikes from 1999 to March 2000 Fed meeting, we got that 50 basis points hike in May 2000. My feeling is history is about to repeat itself and we could see a 50 basis points in the May 2006 Fed meeting, which i think now becomes necessary, if the Fed were to contain the commodity markets melt-up here. Time will tell.
So will i lie by the poolside and sip Pina Coladas while i don't have a signal ? Heck no. I will continue to daytrade this market in the directional of the hourly trend. When my system issues the next buy or sell signal, i will post on this blog.
Tuesday, April 11, 2006
Zone of high volatility
As i posted in the morning, after taking out the 1291.84 swing low, my signal from 3/29 ended in a failure, after seven consecutive good signals this year. A buy signal failure does not automatically generate a sell signal, as i have rules as to what constitute a buy/sell signal. So i turn neutral at this point.
The rules from my system aside, the market is now in a zone of Meltup or Crashes. Here's what's fascinating technically at this juncture. The daily CCI(20) went below -250 at the close on SPX. Here are those rare instances in the last 10 years when the CCI went below -250 and when a ST bottom occured.
3/31/97 - Bottom came 3 days later
10/27/97 - Bottom came one day later
8/28/98 - Bottom came 2 days later
5/25/99 - Bottom came 2 days later
4/14/2000 - Bottomed on the same day
10/11/2000 - Bottom came a day later
3/11/2004 - Bottom came 3 days later
4/15/2005 - Bottom came 3 days later
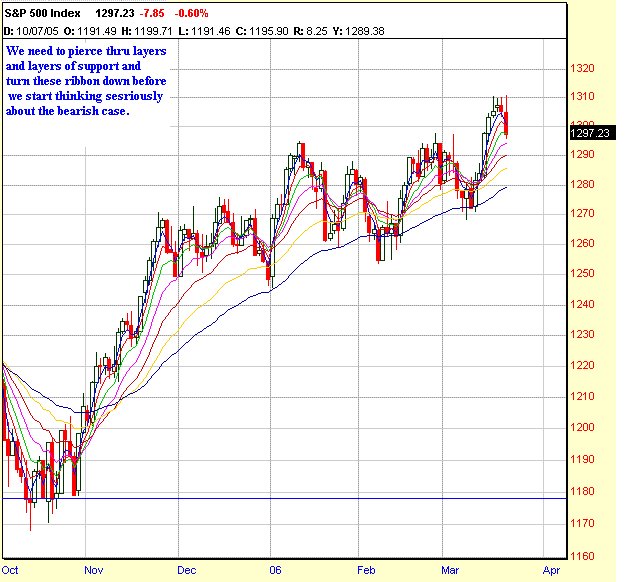
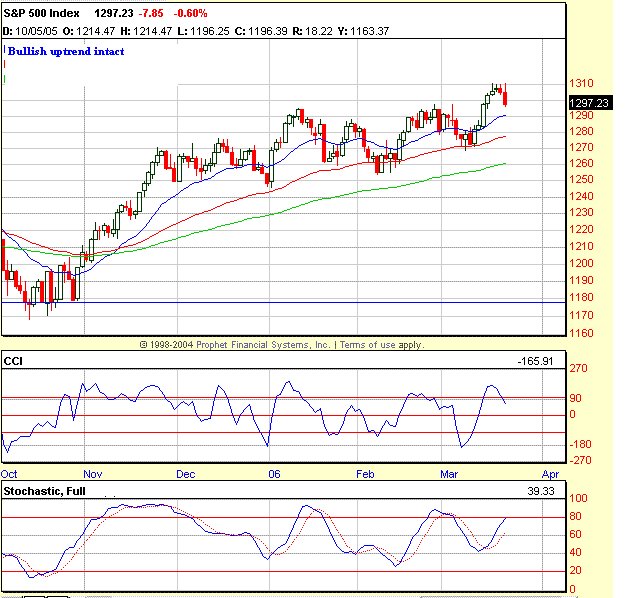
In all of the above instances a ST bottom occured within 1-3 days of CCI closing below -250. In some cases it was a "V" bottom and in some cases the bottoms were retested after a few days of bounce. There's nothing magical as to why this happens every time. If one understands how the CCI is constructed, it's one of the most sensitive momentum indicator out there, as long as it remains between -100 and +100. Once we go above/below +/- 100, the sensitivity drops rapidly. That is a large price movement is required to produce even a small delta on the CCI. Below -250 it becomes almost impossible to push this indicator down anymore. If we were to move from -250 to -300 tommorow, it would require a huge price drop to the tune of 40-50 points on SPX. In other words a mini-crash would be required. And guess what would happen if a mini-crash were to occur, price would snap back like a streched rubber band, cuz it's uncharted territory below -300. So any mini-crash here, if it were to happen, will be all retraced within a matter of hours. Look at April 2000 to get an idea as to what i am talking about or the 1997 mini-crash. If a mega crash like 1987 were to happen, that's a different story. Saying CCI went below -300 and we had a crash in 1987 is totally meaningless without relating to the trend configuration at that given juncture. During 1987, the 8 EMA had crossed below the 34 EMA. The 55 EMA was already sloping down, not to mention the internals then. Today we have a totally different internal configuration and trend configuration. The 8 EMA is still above the 34 EMA. The 55 EMA is still sloping up. The EMA ribbons i am watching are still pointed up to flat. They need to start curling down before we can even start talking about a mini-crash.
There were a few developments today, as far as the internals are concerened, which begs attention. The NYSE MCO took out the March bottom. The 5% and 10% components of the MCO moved belwo the zero line. The NYSE cumulative A/D line went below the 39 EMA. These are negative developments and in the past have led to intermediate term declines. So what this tells me is even if we rally here, a retest will required before a constructive IT bottom falls in place. On other hand if decline sharply without a bounce, then a "V" shape bottoms becomes a high probability event, based on the CCI configuration. In any case, this is the land of quick or dead. Long and shorts are equally dangerous. With this kind of CCI configuration, we could easily see a 20 point short squeeze or a 30-40 drop kind of moves in a day. It's going to be very volatile the next few days as the bottom gets put in place. Think Oct 05 bottom. It's the territory of daytraders the next few days. If we move up tommorow, i will look for a secondary sell signal. If we move down, i will be looking for a buy signal. For now, i am neutral and will daytrade the heck out this market, the next few days. So i patiently wait for the next signal at this point. Until then, good trading...
The rules from my system aside, the market is now in a zone of Meltup or Crashes. Here's what's fascinating technically at this juncture. The daily CCI(20) went below -250 at the close on SPX. Here are those rare instances in the last 10 years when the CCI went below -250 and when a ST bottom occured.
3/31/97 - Bottom came 3 days later
10/27/97 - Bottom came one day later
8/28/98 - Bottom came 2 days later
5/25/99 - Bottom came 2 days later
4/14/2000 - Bottomed on the same day
10/11/2000 - Bottom came a day later
3/11/2004 - Bottom came 3 days later
4/15/2005 - Bottom came 3 days later
In all of the above instances a ST bottom occured within 1-3 days of CCI closing below -250. In some cases it was a "V" bottom and in some cases the bottoms were retested after a few days of bounce. There's nothing magical as to why this happens every time. If one understands how the CCI is constructed, it's one of the most sensitive momentum indicator out there, as long as it remains between -100 and +100. Once we go above/below +/- 100, the sensitivity drops rapidly. That is a large price movement is required to produce even a small delta on the CCI. Below -250 it becomes almost impossible to push this indicator down anymore. If we were to move from -250 to -300 tommorow, it would require a huge price drop to the tune of 40-50 points on SPX. In other words a mini-crash would be required. And guess what would happen if a mini-crash were to occur, price would snap back like a streched rubber band, cuz it's uncharted territory below -300. So any mini-crash here, if it were to happen, will be all retraced within a matter of hours. Look at April 2000 to get an idea as to what i am talking about or the 1997 mini-crash. If a mega crash like 1987 were to happen, that's a different story. Saying CCI went below -300 and we had a crash in 1987 is totally meaningless without relating to the trend configuration at that given juncture. During 1987, the 8 EMA had crossed below the 34 EMA. The 55 EMA was already sloping down, not to mention the internals then. Today we have a totally different internal configuration and trend configuration. The 8 EMA is still above the 34 EMA. The 55 EMA is still sloping up. The EMA ribbons i am watching are still pointed up to flat. They need to start curling down before we can even start talking about a mini-crash.
There were a few developments today, as far as the internals are concerened, which begs attention. The NYSE MCO took out the March bottom. The 5% and 10% components of the MCO moved belwo the zero line. The NYSE cumulative A/D line went below the 39 EMA. These are negative developments and in the past have led to intermediate term declines. So what this tells me is even if we rally here, a retest will required before a constructive IT bottom falls in place. On other hand if decline sharply without a bounce, then a "V" shape bottoms becomes a high probability event, based on the CCI configuration. In any case, this is the land of quick or dead. Long and shorts are equally dangerous. With this kind of CCI configuration, we could easily see a 20 point short squeeze or a 30-40 drop kind of moves in a day. It's going to be very volatile the next few days as the bottom gets put in place. Think Oct 05 bottom. It's the territory of daytraders the next few days. If we move up tommorow, i will look for a secondary sell signal. If we move down, i will be looking for a buy signal. For now, i am neutral and will daytrade the heck out this market, the next few days. So i patiently wait for the next signal at this point. Until then, good trading...
Buy signal from 3/29 fails
SPX buy signal from my system, from 3/29, ended in a failure today, after taking out the 1291.84 (swing low of March 28). This is the first failure out of 8 signals this year. It was very unusual that i had a string of 7 good signals in a row. So it was about time to get a failure, i guess. It's too risky to short here or go long. So i will turn neutral. The next signal could be either a continuation sell or a buy. So we wait....
Sunday, April 09, 2006
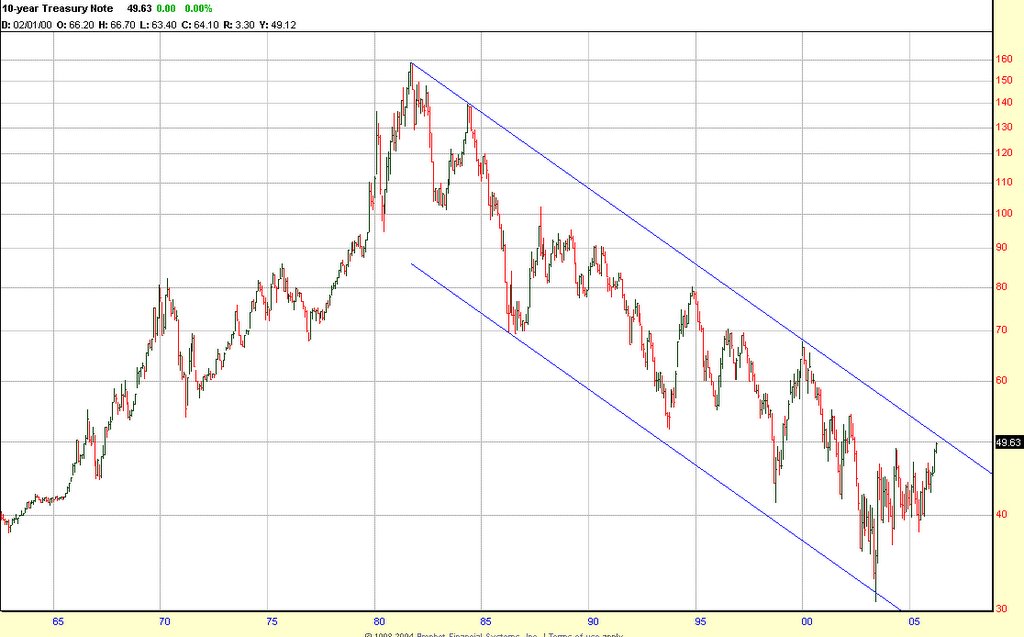
Spooked by the 10-year yields
My system remains on a daily and weekly buy signal. We went close to a weekly and daily combo sell signal on Friday, but escaped by a hair's breadth. I think we should bottom early Monday and take off to the upside again to complete this intermediate rally. Based on the current configuration, i am expecting an intermediate term top to form in about 2 weeks
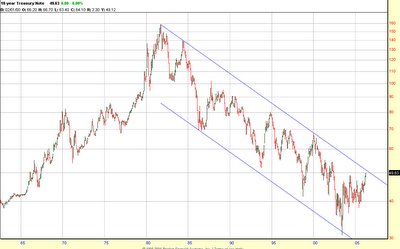
What's spooking the market right now is the 10-year yieds challenging the 25 year old declining tops line. If the 10-year yields break out of the channel shown in the chart, then the technical implication is that a long term trend change has occured in the long end of the curve. Now that does not mean the yields will melt up in the next few months or we will bust thru the channel immediately. Such multi-year resistances are generally not taken out in the first attempt. So we may have to challenge this resitance a few times, before we break out. The bond market vigilantes, if they still exist (LOL) have finally awakened from their deep slumber, it seems.
The global liquidity glut has reached insane proportions. My guess is the Fed would increase the rate by 50 basis points in May, just like they did in May 2000 (when they increased from 6 to 6.5). It could be deja vu all over again. Again that's just my guess, which i beleive will be necessary, if they were to avoid a bond market and dollar carnage here. I think the stocks will continue it's sideways to upward bias until this ocean of liquidty is worked off, which will take a while IMO. As long as Gold keeps rallying, the liquidity spigot is alive and well. I think the first shots of waning liquidity will be fired in the emerging markets, the junk bonds and then the Gold markets. It's only then the stock will start a major long term correction. Until then i think we continue with this frustrating sideways to upward grind......
Tuesday, April 04, 2006
Mired in a trading range
Nothing much to add. We have been mindlessly zig-zagging in this trading range for the last couple of weeks. To me it appears like a high level consolidation before the breakout, which are supported by the internals.
NYSE cumulative A/D line - new highs (both daily and weekly)
Nasdaq cumulative A/D line - new highs on daily
High TRIN, High P/C at or near market highs
There was a small change on the Nasdaq MCO today. So expect some big volatility in this index over the next couple of days.
NYSE cumulative A/D line - new highs (both daily and weekly)
Nasdaq cumulative A/D line - new highs on daily
High TRIN, High P/C at or near market highs
There was a small change on the Nasdaq MCO today. So expect some big volatility in this index over the next couple of days.
Thursday, March 30, 2006
Buy/Sell signals from my system this year on SPX
I have had eight buy/sell signals from my system this year, which i have been posting on this blog. These buy/sell signals are generated at the end of the trading day. So far no failures. Failure happens if the price takes out the prior swing low on the daily charts after the signal is generated. So far among all the signals generated this year, in none of the instances has the price taken out even the prior day's low, after the momentum buy/sell was generated. This year has been atypical in that too many signals have been generated, given the narrow range we have been bouncing around in.
The following are signals this year and the maximum points that each signal would have potentially generated, which is shown in the parenthesis. Note that the maximum points does not necessarily mean that a trade would have made that many points. The number points a trade would have made is entirely dependent on the trade management, such as how many times one enters and exits within the context of a signal, how one trails the stops etc. So the number points made can be either less or more than the maximum potentail shown below, based on how one manages his/her trade.
Jan 13 - Sell ( 28 points )
Jan 26 - Buy ( 14 points )
Feb 2 - Sell ( 17 points )
Feb 14 - Buy ( 22 points )
March 2 - Sell ( 21 points )
March 14 - Buy ( 13 points )
March 22 - Sell ( 13 points )
March 29 - Buy (In progress...)
Avg 18 points per signal
Wednesday, March 29, 2006
SPX buy signal at close - Terminal move ?

My system went to a buy signal at close today, having been short since 3/21/06. I will keep the comments short today. A picture is worth thousand words. After a long time a clear e-wave count seems to be emerging. SPX appears to be forming an ending diagonal here.
Tuesday, March 28, 2006
Will the support hold ?
On March 21 i wrote,
The price trend as evidenced by EMAs is still up without a question. But the momentum went to a sell today. When this happens we typically go down and test the rising EMAs. Remember we had gotten far above the rising EMAs. So some correction was required to bring the prices back to mother earth. I think the brutal selloff we saw on SPX was a wave A selloff. We should see another wave B up and another wave C down to about 1290-1295 region before the uptrend resumes.
Today the wave C tested the 1290 dynamic support. Little did i know last week that it would take so long to test this region. My system remains on a daily sell signal from March 21. My guess is we will get a momentum thrust tommorow, which should issue a buy signal on the daily. I bought some April ES calls around 1301 in anticipation of that. I don't like front running my signals, but sometimes when the risk/reward is too good, i take it.
The larger question for tommorow is, will the SPX 1290 support hold ?
Wednesday, March 22, 2006
Tommorow - Beware of the tactical play
Assuming that we did a wave A yesteday and today's rally was a wave B, then the most obvious way this decline should start is that wave B will either top below yesterday's high or double top at yesterday's high and then do a wave C selloff. What concerns me here is everyone is aware of that pattern and this is what the technical traders are expecting.
What would fool everyone is a tactical play here. There are two ways to do that...
1) Expanded Flat - Wave B will make new highs and then a violent wave C down which will bottom below wave A.
2) Running correction or a irregular flat - Wave B will continue this choppy advance way higher than most shorts would want to be comfortable with and then a wave C decline down which will bottom above today's low.
Both these scenarios can confuse the heck out of everyone. If we make new recovery highs tommorow, then i will start looking to go long on any decline, instead of looking for shorts anymore.
Tuesday, March 21, 2006
SPX momentum sell signal at close
As i noted yesterday the bollinger band squeeze resolved to the upside. Late day we had a nasty selloff. The small change on Nasdaq MCO for 3 consecutive days was warning about some nasty volatility to come. We saw that today. Well that 1315.93 resistance (2001 May highs) proved to be formidable. It's not typical to clear such a multi year resistance on the first attempt. All beared up ? Don't...
NDX is in a daily sell for a long time and it has totally different configuration and is more vulnerable to a downside surprise. Nasdaq summation index is also ready to curl below zero, which won't be a pretty thing if it does.
Let's focus on the SPX. SPX is in a solid uptrend so far, but with that nasty close today, my system generated a momentum sell at the close. The price trend as evidenced by EMAs is still up without a question. But the momentum went to a sell today. When this happens we typically go down and test the rising EMAs. Remember we had gotten far above the rising EMAs. So some correction was required to bring the prices back to mother earth. I think the brutal selloff we saw on SPX was a wave A selloff. We should see another wave B up and another wave C down to about 1290-1295 region before the uptrend resumes. We have had a nice 5 wave impuse from 3/8/06, which would qualify as a wave 1. So my best guess at this point is we are in a wave 2 correction, which should end at the 50% retrace of the impulse, which is around 1290. After that i expect a strong persistent wave 3 advance, which should purge all the remaining bears. This scenario could change if we get a daily close below 1290. For now this remains my preferred count.
Another techincal matter of interest is that the daily CCI on the SPX went above 220 during this runup. Market does not do certain things without intentions. In the past on those rare occasions when the daily CCI had gone above 220, it had resulted in major trending phases. I don't have time to post those charts. But take a look at 1997-2000 when at least 4 or 5 times the CCI went above 220 and checkout what happened after that. It could be an eye opener.
The sentiment picture is very interesting. I have never seen so many bears at the top. With so many rydexers shorting the indices from their retirement accounts, it's hard to conceive a major bull market top happening here. There's simply no acceptance of the rally. Everyone is either obsessed or worried about a 4-year top here. Whether we made a 4 year top or not is totally immaterial from a trading perspective, unless you are advisor trying to make a name for yourself or keep your subscription base sufficiently excited. I am sure a host of advisory services today will be screaming 4-year cycle top from their rooftops !
None of the daily signals i have got this year on SPX have failed so far. I have a sneaking feeling that this sell signal could end up in a whipsaw.
Bottomline , the next couple of days or as long as this sell signal is alive, i will be looking to short the indices on a intraday basis. I am not comforatble taking a swing short position at this stage at all.
Monday, March 20, 2006
Bollinger bands are getting squeezed
The SPX daily remains on a buy signal.
On the SPX hourly the bollinger bands are squeezed tight. Today appeared like a high level consolidation on the hourly charts. The hourly oscillators are oversold with little damage to price. So my guess is this consolidation will resolve to the upside tommorow.
Nasdaq has had 3 consecutive small change days on the MCO. This means a big price move is coming in the Nasdaq in the next day or two. The price move tends to be large when we have such huge indecision on the MCO (in this particular case for 3 days). Caution is the keyword here.
Friday, March 17, 2006
Significant developments

SPX daily, remains on a buy signal from March 14. Technically we are at a very exciting juncture.
For the first time, we had a weekly close above the ascending wedge, since it begun in 2004. Ascending wedge is a technically bearish pattern. But on those rare occasions when we manage to break above the wedge, it becomes an extremely bullish pattern. It's a very significant development. Breaking out of the wedge is called a throwover, if it reverses quickly back into the wedge. So any failure here could be nasty. We need sustain above the upper trendline of the wedge to maintain a bullish posture going forward here.
On the otherhand, all the internals are pointing to a healthy breakout here. Nasdaq and Semis have been the laggards, which is keeping a lot of folks from not participating or not beleiving in this rally. The NYSE daily and the weekly cumulative A/D lines are blasting higher and are making new highs. The NYSE MCO has taken out the Feb highs. The MCSUMS on both the NYSE and Nasdaq have turned up. NYSE cumulative TICK and cumulative New highs- New lows are all making new highs. The OBV on SPX is at new highs. No diveregences anywhere, as far as the NYSE group of stocks are concerned. On the other hand, the Nasdaq internals, such as the weekly cumulative A/D line looks downright horrible, which is what is keeping the folks bearish. Every internal measure i am seeing on the NYSE are looking healthy at this juncture, which makes me beleive that this could be the real Mccoy !, after a year long trading range.
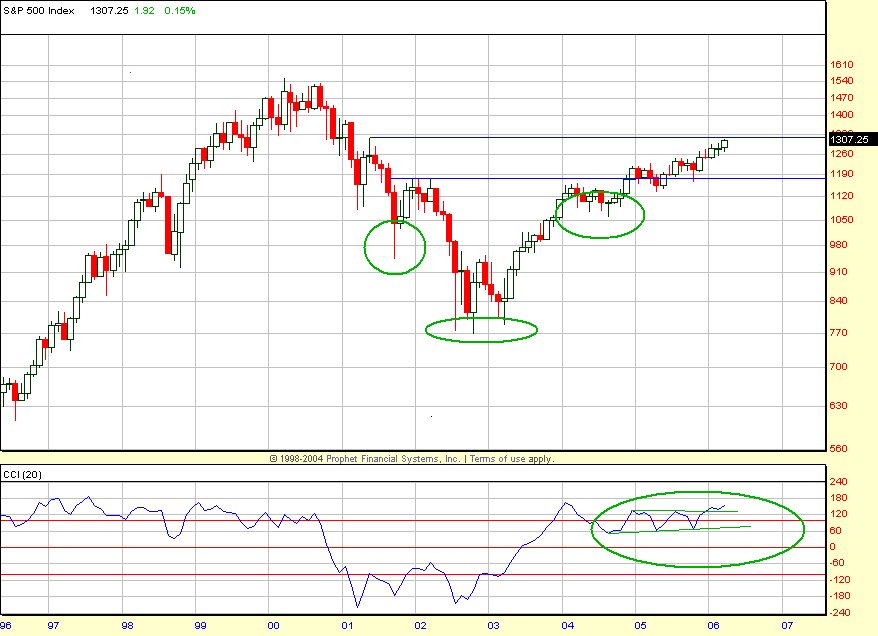
Here's another chart to put things in perspective. After breaking out above the 2002 highs in late 2004, we have been in a trading range for the most part of 2005. Now we are about 8 points away from taking out the May 2001 highs at 1315.93. If 1315.93 gets cleared and holds next week, things could get very hot on the upside. Then SPX 1388 would become the next technical expectation. It's not typical of the markets to clear such major resistances on the first attempt. So i would expect some backing and filling around these levels before we clear that resistance. Notice, the monthly CCI has broken out of the long trading range we have been in since the beginning of 2005. So we do have the momentum thrust to breakout into a large impusive move here.
Any daily close below 1295 would bring the breakout into question big time !
Tuesday, March 14, 2006
SPX buy signal at the close

The dreaded V bottom bagged the bears today.
My system issued a momentum buy signal on SPX at the close today, having being short since 3/2/06.
I mentioned a couple of days back about the Technical vs the Tactical trading. On March 10 i wrote,
On the other hand DOW issued a daily buy signal today, suggesting a "V" bottom might be in place. I don't trust the DOW and NDX daily signals for i think SPX is the proxy for the U.S markets. SPX and NDX remains on a solid sell. Remember this market is all about tactical trading. My above mentioned technical scenario may or may not work, as the whole world knows how to pick a divergent bottom, creating efficient markets, if such a scenario were to pan out. So from a tactical trading perspective, we are at the right juncture to mount an assault on the bears. There are tons of bears out there with huge stops above the SPX 1300 level. And SPX is just 15 points shy of the 1300 level. So if we were to rally and take out the 1300 level, there should some massive short covering. Also NDX is perched just below the declining tops line from 3/3/06. If we were to gap up above that trendline on Monday, a lot of trapped NDX bears could get scorched badly.
The technical expectation of a "W" bottom apparently did not occur. The tactical trading dominated once again and the dreaded "V" bottom is in place now. Look at how nicely the CCI put in a V bottom. Bottomline, i will be looking for longs going forward.
Monday, March 13, 2006
No change
SPX and NDX remains on a sell signal. DOW remains on a buy signal. There's a good chance that DOW could make new recovery highs. Will be looking for shorts tommorow..
Friday, March 10, 2006
Be careful out there...
I coudn't post yesterday as i had problems accessing the blog.
However, i posted this at www.traders-talk.com forum yesterday
http://www.traders-talk.com/mb2/index.php?showtopic=49601
Based on channelling, SPX cash 1286-88 seems like a strong magnet right now. Even time wise, the correction is not complete. My guess is either we go up straight and test that area today noon or decline in a wave B and do the wave C up tommorow to satisfy the time requirement.
Now the first part worked out fine. My opinion has not changed even given the ugly close today. I think we rally in a wave C to 1286-88 area tommorow and then continue with the downtrend.
This forecast worked in a picture perfect way. I went long at ES 1283 and got out around the 1294 level. I was looking to go short in a big way around the ES 1296 level. But as we rallied to the 1295 area on ES, the hourly oscillators were barely overbought, which suggested more upside. More importantly DOW gave a daily buy signal at that point, while the SPX and NDX daily remained on a daily sell. Something was clearly wrong and i didn't go short. Then we had a scary decline and an equally sharp rally thereafter.
Strictly from a technical perspective, if we were to put in a solid intermediate bottom, we need to decline here to retest the 3/08/06 lows, which would create a nice divergent bottom. From all the technical evidence i have at this point, the bottom is not in. I think the internals have put in a bottom as of yesterday. The strong breadth we had today can be treated as accumulation and a snapback action towards the zero line. So we still need to see the price bottom, which always follows the internal bottom. Going by this strict intrepretation of the current scenario, we should see a scary decline next week to test the price lows of 3/8. That would create a nice "W" bottom both on the price momentum and the MCOs, which would give a solid fondation for further rally.
On the other hand DOW issued a daily buy signal today, suggesting a "V" bottom might be in place. I don't trust the DOW and NDX daily signals for i think SPX is the proxy for the U.S markets. SPX and NDX remains on a solid sell. Remember this market is all about tactical trading. My above mentioned technical scenario may or may not work, as the whole world knows how to pick a divergent bottom, creating efficient markets, if such a scenario were to pan out. So from a tactical trading perspective, we are at the right juncture to mount an assault on the bears. There are tons of bears out there with huge stops above the SPX 1300 level. And SPX is just 15 points shy of the 1300 level. So if we were to rally and take out the 1300 level, there should some massive short covering. Also NDX is perched just below the declining tops line from 3/3/06. If we were to gap up above that trendline on Monday, a lot of trapped NDX bears could get scorched badly.
So technically speaking no price bottom yet, but from a tactical viewpoint, we might have seen it. Bottomline i will still look for shorts on SPX next week, but will change my opinion in a heart beat, if the price action proves me wrong and i get a daily buy on SPX.
Be nimble ! Have a good weekend...
Wednesday, March 08, 2006
Run for roses or Run for exits
Let's throw the emotions(one day rally), fundamentals (BOJ decision) and funnymentals (Wierd Wollie Whatever..) aside.
Let's look at basic TA. As i mentioned yesterday, the hourly Full Stoch was putting in a complex bottom, which suggested a sharp rally for a day or two. So today's action did not surprise me. The daily momentum is still on a solid sell. CCI(14) on the daily SPX went to -190. When the daily CCI reaches this low levels, it's hard for market to rally without putting in a divergent bottom. CCI(20) failed to turn up even with today's rally and is forming a shelf from which it can fall off rapidly. CCI(20) also has more room to run on the downside. The only way the market can rally in these kind techincal scenario is a straight run without pause which can create a V shaped bottom. Typically when a V shaped bottom happens, the rally out of the bottom tends to be very sharp and we see a 2%+ day. Had we got a 2% rally today and the CCI(14) had hooked above 100 and the CCI(20) had hooked above 0, that would have been a good indication that a reverse divergent setup was confirmed and a V shaped bottom is behind us. But today's action had none of those characteristics.
What is in the bulls favor though is a series of High TRIN days and High P/C ratio days. When the market is trending up and a couple of high TRIN days occur, it could be a sign of a ST bottom. When the market is already in a downtrending mode and we see the high TRIN days, it generally is a precursor to a capitulatory kind of selloff, which has not happened yet.
My own take is we run for the exits before we start the run for the roses. Will look for shorts tommorow, if we don't see a strong run up in the morning.
Subscribe to:
Posts (Atom)
