Saturday, June 16, 2007

That pesky "W" bottom

I was of the impression the last couple of weeks that SPX was headed to 1450-60, which was a logical IT price target based on the fact that the IT pivot was broken and the NYSE MCO made a new flag. I even posted on traders-talk, the exact day the countertrend rally begun and was expecting a rough target of Sep ES 1536-38 . Once it broke above that level, i was questioning myself.

Now in hindsight, it's clear that SPX put in a "W" bottom. The "W" bottom was tricky to spot, because of the fact that the price did not make lower lows, but ended up as higher lows. We have seen many such lows in this bull market from 2003, which has shown this phenomenon of higher lows. This typically is a product of "Extreme bearishness" at bottom and the system getting clogged so severly with shorts that any countertrend rally ends up in a epic squueze which creates a new leg up. I was one of the first to publish a IT target of 1450-60 when the declione begun. When every newsletter and blogs on the web were abuzz with that number, that was a kiss of death for that target. As i said, i was expecting a restest of the recent lows on SPX till yesterday. But i abandon that view at this point.

One chart says it all. The NYSE MCO made a higher low and price did a retest although that retest ended up as a higher low, which is what threw a curve ball !. The summation has turned up. More important the 5% and 10% components of the MCO are now above the zero line, which keeps the IT uptrend intact again.


As for the VST term, 120-min trend has turned up. Once it turns up, it's very difficult to turn it back down immediately. I say this from my experience and also from examining a large historical data series. So the path of least resistance is now up and will continue so for the next 1-2 weeks at least. The only way the 120-min can be turned down at this point is to have a high velocity selloff of about 25 points on Monday, which i think is very low odds. The market does everyting for a reason. The breakout above Sep ES 1536-38 resistance made it clear that the market was headed much higher. The next logical target is all time highs on the SPX or a double top just below it i.e SPX 1550-55.

Now here's the fun part, which i am sure the Perma bulls will ignore yet again and call for a wave 3 of 3 again. The weekly momentum has turned down, while the daily is up now. Once the daily gets fully overbought here and turns down, it would produce a "Combo Weekly and Daily sell signal". The decline from that signal will be far more powerful and larger than what we witnessed last week.

Bottomline VST, ST, IT bullish. I will post on this blog when the 120-min approaches the sell signal again.

Monday, June 11, 2007

VST, ST and IT pivots - all broken in 3 days.

Daily chart


The same signal which gave a daily buy back in March is now on a triple divergence sell. Some rough IT targets for this decline at this point is around SPX 1450-1460. Will refine it, as we move forward. The NYSE MCO has created a new flag, which means the internal low is probably in and the price low in the form of a lower low is pending. If that lower low on price creates a positive divergence with the MCO, then we should expect another leg-up towards new recovery highs. But it's too early to speculate on that. As for a "V" bottom here, i am not a beleiver. In any case, "V" bottoms have 20% odds as opposed to 80% odds for a retest. So i am positioning myself for a retest.


VST chart


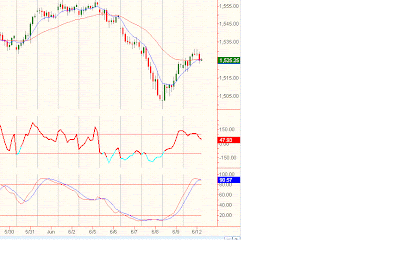
The Full Stochastic on the 60-min chart is fully overbought and is turning down. The EMAs are on the verge of a backkiss. The 60-min CCI diverged and has turned down. So the odds that the bounce from Friday is over, looks very high.

Wednesday, June 06, 2007

Inflection point...


If we get a gap-down tommorow again, it could be a VST buy, but it would clearly break that controlling channel on the 120-min charts. So those betting on a irregular flat correction will have to give up. The controlling trendline from the 3/16 lows is already taken out. If you are a blind bull, then that downthrust in the NYSE and Nasdaq MCO may not mean anything.


Let me tell you something. If the uptrend is alive, the market will start going up from the get-go tommorow without breaking below that cahnnel, as though no technical damage has happened and will never look back. A close on 120-min basis below that channel tommorow will be a high odds signal that we are looking at more than a VST correction with much more downside to come. The summation on both the NYSE and Nasdaq has turned down. The breakdown in the MCOs do not look like a hesitation pattern, but looks something decisive.

To me any daily close on the ES below 1512.50 would mean that the back of the bull is broken and a multi-week correction is underway. What shape the correction would take is anybody's guess at this point. Clearly we are at a inflection point.

Analysis only provides the framework for my trades. Those who are interested in my trades , i post them on traders-talk.com.

Tuesday, May 15, 2007

Before i leave for the vacation....


I am going on vacation and will be back on June 1. Before i leave, i thought i would post a chart of the daily charts rolling over. The picture says it all !

Thursday, May 10, 2007

Daily momentum sell at the close

My system generated a momentum sell on the daily charts today.

Last time i commented, i had a VST bias into SPX cash 1493, which got tagged today. If the uptrend on the hourly charts were intact, then we would have seen a powerful rally out of that pivot. The fact that the pivot did not hold and the daily momentum kicked into a "Sell", means, this is more than a VST correction. So i would not be a buyer here. Not yet !

Now the million dollar question is whether this is a ST correction or an IT correction. The ST pivot on the SPX cash comes around 1474-1478 area, which should be the focal point for the daily trend traders to go long. Again, we'll evaluate if and when we get there. If the 1474-78 area cracks on a daily closing basis, then it would blossom into a full blown IT sell, which would target the SPX 1420-30 area. Again, i don't pretend to have a crystal ball that far. So taking one baby step at a time.....

Also of interest is that the Nasdaq MCO broke below the late April lows. Both the 5% and the 10% trends on the Nasdaq MCO are now below zero, which is also suggesting that this is more than a VST drop. The NYSE MCO is barely holding above the late april lows and if it follows the Nasdaq, the next day or two should see the NYSE MCO taking out those lows.

Monday, May 07, 2007

No top of importance in sight

Sorry i coudn't update my blog since April 23, since i had some personal preoccupations.

My April 23 forecast for a drop to 1452 was invalidated by the market action. I was wrong !. Every day the market throws new information. Only a stubborn ego-maniac analyst can afford to ignore such information. Right now the market says that we have not seen any top of importance. So as a trend trader, the next area of importance seems to SPX 1493, which should be the area where a hourly swing/trend trader need to focus on going long. For VST traders, today has a downward bias for a drop into SPX 1493.

Monday, April 23, 2007

ST Top ?

Based on the pattern, momentum on daily charts and dynamic supports on daily, i have some targets which should be acheived within a week.

ES 1452-1454, NQ 1800-1805.

Violation of Friday's highs on a hourly closing basis will invalidate these projections. I remain short NQ from 1854 with a stop above today's highs. Based on my 30-min charts, it appears that we will start with a gap-down on Monday. FWIW.

Friday was a Euphoric close with a closing tick of +1250. Those who were buying the close went home with the expectation of a probable gap-up. Talk about "To da moon anxiety" !. Top tick closes, especially on OPEX fridays is a bearish sign. Monday could end up as a big red candle day !

Wednesday, April 11, 2007

8 hours of bearish excitement

May last another couple of hours tommorow morning biggrin.gif

As i commented in my blog last, the market looked tired as we approached 1448 and a reaction looked inevitable. My downside targets for the move was SPX 1428-30 (ES 1438-40). I will refine it to SPX 1430-32, which should be tagged tommorow morning.

ES 1440-42 is a key area, which should provide support. If this area is breached, then lower targets like ES 1428-30 will come into play. Need more clues in the form of price action tommorow to determine if that's the case.

In any case, the next move of consequence should be a move to a new recovery highs on the SPX.

Monday, April 09, 2007

VST top

If i wanted fame, i would have made a dramatic call that the next 100 points on SPX will be down or this top will not be seen in my lifetime. But i am a trader and i want money :-)

I do not see anything that suggests a major top is in place. But that does not preclude any non-linear drops, which i can't predict with any TA methods. Last time i made a projection was when SPX was trading near 1416. I had a preliminary projection to around SPX 1455-1460. I have to refine those targets now to yesterday's high at 1448.10. Good enough for government work.

The smart money OEX folks were loading up on puts with OEX P/C ratio hitting intraday highs of 3.81. The not-so-smart equity folks were loading up on calls like there's no tommorow. So i am expecting sometime of reaction to the downside over the next couple of days.

At a minimum we have a swing top in place on the hourly charts based on my work. The next move should take us to ES 1438-40 (SPX 1428-30). After this breif reaction, the uptrend should continue.....

Friday, April 06, 2007

OIH - rolling over on all timeframes !


On the OIH, weekly momentum is overbought and rolling over. There's major horizontal trendline resistance and also resistance from the broken trendline. In the second charts the daily momentum is showing severe divergence and the daily Stoch is overbought and trying to rollover. On the 120-min, again, it's overbought and trying to rollover. One can only conclude that we are at a IT turning point on the OIH. I am expecting OIH to severly selloff starting Monday, which should be a good indication that the trend has turned down. Otherwise we might fool around the resistance area for some more time. Either way, a major correction is not that far away.

Thursday, March 29, 2007

Some Intermediate term thoughts

Been busy with other things and could not update my blog since Decmeber. Going forward, i will try to update my blog on a regular basis.


The popular consesus among the wave analysts seem to be that the decline from 2/22 to 3/14 was the wave A and currently we are in wave B. So most are expecting some sort of a selloff to retest the recent bottom, which would qualify as wave C.


One of the most interesting technical aspect here to me is the NYSE MCO. MCO broke below the 2006 May lows. Normally this should result in some kind of a retest of the recent lows to produce some bullish divergence between the price and the MCO, in order to begin a new sustained uptrend. But a closer look at the 5% and the 10% trend shows that the 10% trend of the MCO never broke below the 2006 May lows. The slower 5% could not catch up with the faster 10% creating a wide difference betwen the same, which smacks of panic selling, which is what created that panic low on the MCO. Panic lows sometimes never gets tested, which is the risk of being bearish here. So maybe the low is already in. Even if the retest were to happen, the time consumed by the wave B has been too small to consider it complete.

In the ST though, the risk is to the upside for a retest of SPX 1460. Whether the wave C begins after that or not needs to be seen, based on the quality of advance and the technicals at that juncture. Right now the 120-min price trend is still up and my goal is to ride that until it turns down. The last few days of market action can only be qualified as a choppy sideways correction. Only a strong impulse down here and the break of the important pivot at SPX 1400 would mean that wave C has started. I highy doubt that scenario at this point. I am looking for a move towards SPX 1460 in the next 1-2 weeks.

Thursday, December 07, 2006

LT and IT update

I wrote about my long term thoughts in this post a few months back.

http://nav-ta.blogspot.com/2006_09_01_archive.html


I thought i would update my IT and LT thoughts here.


As for the LT, 2003 marked the primary degree wave A bottom and currently based on all the evidence i have, we in a primary degree wave B, which has ways to go before we can call any long term top, which should probably occur between 2009-2010 depending on how the wave progresses.

Within the Primary degree wave B, we are currently in wave 1 of C, which is topping and should lead to at least a 100 point decline on the SPX, by about June 2007. I have shown my primary count in green and there's no reason to change the forecast unless something dramatic happens or the economy weakens significantly beyond what is being discounted by the market. Some fundamental factors are screaming that we are headed, at a minimum for a major slowdown in the U.S economy or worse a recession.

1) 10 year Yields breaking down
2) Inverted yield curve
3) ISM below 50
4) Crude in a confirmed weekly downtrend
5) CRB in a confirmed weekly downtrend


All these significantly increase the chances of a major slowdown in the U.S over the next few quarters. Now what is unknown is the extent or the degree of the slowdown. Based on the larger degree wave pattern in the stock market, this may end up as nothing more than a slowdown rather than a full blown recession. I have an intermediate term target of about $38-40 on the crude oil, again based on the wave pattern, by mid 2007. That also coincides well with a stock market bottom around that time.

The Fed has found the panacea for all ills (or so it thinks), which is the rate cuts. So any slowdown into mid 2007, will be met with aggressive Fed rate cuts. This will not only create a melt-up in the stock market, but also in the whole commodity complex into 2009-2010. OIL could goto $100+ dollars by then, again based on the e-wave pattern. SPX should head to 1640-1800 by 2009-2010. I think this is where the overwhelming inflationary forces will cause the FED to lose control and kick off the deflationary primary degree wave C, which the bears have been prematurely betting on for many years now.

Now if the current slowdown morphs into a full blown recession, the longer term outcome of the stock market would not change, but the IT term would have to be changed drastically i.e a decline into SPX 1020 is possible and that's what i have shown in my alternate count in pink. While i am not expecting that scenario at this point, it's something to keep in the back of the mind. Some major monthly pivots have to be broken before we get there and the monthly MAs have to curl down, before that happens. It's too early to get that beared up IMHO. Again this is all a roadmap just for some perspective not a trading plan.

Feel free to disagree with my outlook. But it is what i am seeing at this juncture.

Wednesday, November 29, 2006

Big whipsaw days

Today caught me by surprise. I was expecting that ES 1391-1394 would offer serious resistance, to be followed another leg down. Instead the market displayed some unusual strength and as soon as 1395 was taken out, i knew that the gap at 1403 would be the magnet. Got stopped out for 5 points loss. These kind of multi swing action is typical at the tops/bottoms and is a harbinger of trend change to come. I think it was George Soros who said the market becomes choppier at the turning points. These kind of moves are bull-bear tug of wars at turning points, which eventually results in range expansion and a change in trend. I am still of the opinion that the top has been seen. There's a remote chance that we could do a marginal spike to 1415-20 and then breakdown. That is low odds at this point.


As for the larger picture, take a look at the chart.

Look at the MACD indicator (my custom MACD), which did not produce one single sell all the way from the bottom to 1388. That is why i was bullish all the way up to 1388!


I hope you remember my call on 10/26, where i called for a decline to ES 1367, which was precisely hit. That was the primary sell. Then we made a secondary top on 11/22, which produced that selloff off of that terminal, which i again called last Sunday. Note the huge divergences betwen 10/26 and 11/22. It's not just the divergences i am trading on, but i do have a momentum break on the daily as well. And then the internals - Nasdaq MCO took out the Nov low and the nasdaq summation is now pointed down. NYSE summation was also pointed down yesterday, which recovered today as the MCO made it's trip to the zero line. Last but not the least, if we close below 1377 SPX, i will also have a weekly sell signal. When the daily and weekly combo goes on a sell, then you can be assured that the IT top has been seen.

Tuesday, November 28, 2006

Oversold bounce

Nothing to add here and my ST target remains at SPX 1360. Reshorted ES at 1389.50. Will add to shorts, if we gap-up tommorow morning

Monday, November 27, 2006

Very Nasty internals

From Nov 24

We should see a fast selloff to SPX cash 1360, virtually giving no opportunity for anyone to position short. This is a unique point in the price structure where the pattern, price-action and the momentum are all converging to a sell !

The selloff came right on schedule and as i said the nastiness gave very few people a chance to position themselves for the decline. The only folks who probably profited from today's decline were those who were already short. Many would have thought i was nuts when i made that call on Nov 24. I don't make these calls until everything in my work lines up.

Now what was noteworthy today was the nasty breadth and the heavy volume on the selloff. In the first hour of trading 400,000 ES contracts changed hands. I think for anyone who watches the tape, it was a no brainer that the day was going to end badly, closing at the low tick of the day.

The NYSE A/D line was 12% : 78% and so was the Nasdaq A/D. The Nasdaq volume A/D was 7% : 92%. That pretty nasty internals folks !. Also noteworthy was the fact that the Nasdaq breadth MCO broke below the November lows, which means this is not going to be a one day affair. So we are in a ST downtrend. The VST selloff should end in the next 1-2 days after making a complex bottom on the hourly momentum, before we see any sustainable bounce. My ST target remains at SPX cash 1360.

I actually covered my shorts today, half at 1390 and the other half at 1383.25. All posted in real-time on traders-talk.com

So far, no IT pivots are broken. So Bottomline ST bearish, IT/LT bullish.


Sunday, November 26, 2006

We are likely headed into a recession !


The fake poke !

When the 10-year yields made a monthly close above the long term channel from 1982 (back in June 06), i was convinced that we were entering into an inflationary environment. Boy, was i wrong ! That was a massive headfake. Now that we have reverted back into the channel, it's sending a powerful message that we are likely headed into a recession. Nothing is gauranteed in the markets. But when the markets send out powerful signals, we just gotta listen or endure financial ruin. If T-Notes breakout above 108.75, then the yield curve inversion would steepen beyond any economy bulls' threshold level. Is the economy strong now ? You bet !. Was the economy strong in the spring of 2000 ? You bet !

What does this mean to the equities ? Well, i don't like mixing market analysis. Right now it's ST bearish and IT bullish for equities. That could all change. I will update if and when any major IT pivots get broken. Stay tuned....

Friday, November 24, 2006

Terminals are tricky


Terminals are tricky, which is why even when most e-wavers detect them, they fail to trade them. The problem with terminals is that they don't unfold in a text book fashion. Either they end in a throwover, giving the illusion of breakout and scaring the heck out of the short sellers or they truncate, keeping folks waiting for that another not-to-come leg up. In this case, it looks like a classic case of truncation to me. Wave b unfolded as a irregular flat and wave d as a triangle (alternation) and then there's waning momentum from wave a to wave c to wave e. We failed sharply after wave e. Then we went and backkissed the broken wedge and failed sharply again today morning.

Both my terminals calls i.e ending diagonal pattern calls in 2004 and 2005 were right on the money. One can go back and search my posts on traders-talk.com. I have reasonable confidence that this one is a terminal too. If so, we should see a fast selloff to SPX cash 1360, virtually giving no opportunity for anyone to position short.

This is a unique point in the price structure where the pattern, price-action and the momentum are all converging to a sell !

Short from ES 1407.

Enjoy your holidays !

Tuesday, November 21, 2006

GROSS !


In my last post i said, my hourly went to neutral and closed all my shorts and went flat. In hindsight, it was a good decision. Now we have a better price to short and all my ST indicators are lined up.

My best guess at this point is a rally in the morning to around SPX cash 1412-1416 area and then a strong selloff. If we do get the rally, i will be shorting the strength. Instead if we breakdown below the channel shown on the 120-min chart, i will start shorting the bounces. Either way, a ST top is forming right here. If i have to describe the 120-min chart in one word - GROSS !

I do not have enough indications to call it a IT top yet. But the ST selloff could blossom into a IT selloff. Stay tuned....

Bottomline -> ST - bearish, IT - bullish, LT - bullish

Monday, November 13, 2006

Hourly signal in neutral territory

Break above ES 1395, i will go long on pullback. Break below 1377, i will short any bounces. The hell-in-between, i will scalp. Went flat today. Not a time to be opinionated when the hourly bands are getting squeezed and the hourly EMAs are flat, which means indecision - a big one at that.

Thursday, November 09, 2006

Hourly sell still in effect

Hourly sell from Tuesday is still in effect. We had a post election gap-down, which pushed some VST indicators to extremes, causing that recovery on Wednesday. Today we gave up all that gains. Now the hourly is nowhere near oversold conditions, to worry about any major rally here. Based on 30-min and 60-min indicators, we could bottom tommmorow morning somewhere around the 1376-78 area, which should lead to a small bounce before another leg of selloff starts....

Bottomline: ST bearish, IT neutral, LT bullish.