Tuesday, December 28, 2010

E-wave count for SPX - Dec 28, 2010

Sorry, i have not been actively blogging the last few months. I will try to post the e-wave count for SPX going forward, both on a weekly and daily basis.

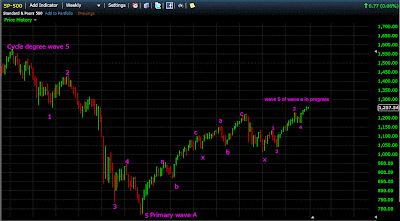
On the weekly charts we are close to completing the wave a (currently in progress). After this a multi-week correction should be the expectation. But this is not going to be the end of the bull market. There will another leg up after this correction into the spring of 2011 before the fat lady sings.


On the daily charts, we are approaching the end of wave 5, which should kick start a multi-week correction. Use extreme caution here, if you are long. Tighten the stops to the SPX 1232 pivot. I will update here when the turn is confirmed.


Sunday, September 05, 2010

SPX LT Oscillator - Close but no cigar !

Here's a long term Oscillator, which i have been showing on this blog for many years to track the LT turns. Well, since my system on SPX is proprietary, i cannot display any of my trading charts. So I decided to at least post this long term Oscillator for the benefit of those who are into LT investing. This Oscillator is not of much use to a trader as much as for an investor. But it certainly can be indicator to demarcate bull and bear markets.

The rules are pretty simple.

1) For a bear market, we need to have a lower high and lower low on the weekly price charts and the Oscillator has to cross below zero.

2) For a bull market, we need to have a higher low and higher high on the weekly price charts and an oscillator crossover above zero


This week, the market was on the brink of a LT breakdown, but escaped marginally. What the LT bears would not like to see here is a curl up of this MACD above the signal line, which would give back control to the bulls.

In my last post, i had said that the strong rejection from 1130 pretty much nailed the 9 month cycle top. Now the failure to break the SPX 1010 lows and a strong rejection from there pretty much neutralizes the situation. In other words, we are back to square one. My guess is we will double top around the SPX 1130 area and start the next leg down into the 9 month bottom lows due late Oct. But that's just a guess at this point. In a week or two, the market should start giving additional clues.

Good luck trading !

Thursday, August 12, 2010

9 month cycle top confirmed

There was some ambiguity as to whether the May top at SPX 1173 or the the June top at 1131 was the 9 month cycle top. The strong rejection from 1131 pretty much confirms the 9 month cycle top. We should head into the 9 month cycle bottom from here, due in late Oct-Nov

My trendicator also moved to a sell yesterday without a CIT. It's going to be very hard trading this coming volatility with the daily charts(or daily trendicator). By the EOD, a lot of damage can happen. I will start posting the hourly buy/sell signals on traders-talk.com, for those interested.

I will post occasional updates on the daily trendicator here and some big picture thoughts.

Tuesday, August 10, 2010

Quick update

The trendicator remains on green status.


Given that S&P is trading below 1131 June highs, it still remains ambiguous as to whether the May 1173 or June 1131 highs constitute the 9 month cycle top. S&P has been forming a triangle over the last few days on the hourly charts. Triangles precede terminal spikes. So we could see most likely see a celebratory spike over the next few days above 1131, before we say adios to this rally.

In the event i get a CIT warning, i will post an update here.

Monday, August 02, 2010

9 month cycle thoughts

On July 28, i wrote


If today's lows gets taken out, then it would generate a sell with a projection to about SPX 1080-85. I don't see any projections beyond that, at this point.


We acheived that projection. But the trendicator moved from a sell to a outright buy today, without a CIT warning, in a shock and awe style upmove.


We have a 9 month cycle bottom which is due in late Oct - early Nov 2010. Every 9 month cycle bottom after the Oct 08 bottom have made higher lows signifying a cyclical uptrend in prices. In May 2010, we broke the 9 month lows of Feb 2010, and consequently the cyclical uptrend, which indicates that the next 9 month cycle low will potentially be a lower low.

The 9 month cycle crest is amibigous here. It's either the May 2010 top at 1173 (if the cycle was left translated) or the June 2010 top (ideal top) at 1131. Now we are 4 points away from the June 2010 top. Will it hold ? If it was a 9 month crest, it should reject prices strongly here. If not, it would confirm that May 2010 was indeed the 9 month crest and prices should move towards there for a retest and then fail there for a downmove into the 9 mont bottom due late Oct.

If SPX 1173 gets taken out, then the bearish case is over. That would mean a extremely right translated 9 month cycle and the implications are ultra-bullish.

The trendicator is on a buy. So we are back to buy-the-dips mode. But keep an eye on the 1131 and 1173 resistances and watch how the price reacts there. If we see volatile back and forth action below the resistances, then it's a clue that a potential top is getting built.

Good luck !

Thursday, July 29, 2010

Trendicator moves to red

Trendicator moves to red, following the CIT warning yesterday.

Wednesday, July 28, 2010

CIT warning

My trendicator has given a CIT warning. CIT warning is not a definitive sell signal. But usually a CIT warning translates into a sell signal the next day, if the low of the daily candle that triggered the CIT, gets taken out. So if today's lows don't get taken out tommorow, then it was much ado about nothing. If today's lows gets taken out, then it would generate a sell with a projection to about SPX 1080-85. I don't see any projections beyond that, at this point.

Well, the upcoming 9 month cycle bottom due in Oct-Nov timeframe is in the back of my mind. But it's too early to say that this is the start of that big decline. Weekly has to turn down before such forecasts are made. At this point the weekly is pointed up. So i will treat this as a correction in an uptrend.

Tuesday, July 27, 2010

No change

Power uptrend continues...


Thursday, July 22, 2010

Power trend


Just a quick update. We had a big up day as i posted yesterday. My trendicator has entered a power trending mode now.

Here' some quick details on what a power trending mode means. Power or strongly trending markets are those, where the odds of sucessfully executing a countertrend swing trade becomes extremely low. It does not preclude one from intraday countertrend trades or quick scalps, but is unforgiving when it comes to trying to swing against the trend. Power trend does not measure the size or duration of the move. The move could run for months or end even after a day. It just attempts to charaterize a trend which is in a high momentum zone. So it pays to wait for a potential CIT or actual CIT before any countertrend swing is attempted from this mode.

Wednesday, July 21, 2010

No change

The action on the hourly charts today was ugly, but my trendicator failed to produce either a sell signal or a CIT warning. I would have at least expected a CIT with this kind of action. But surprisingly, i did not get one. So the trendicator remains on Green. If the trendicator is right, we should get a huge up day tommorow. If not.... :-)

Tuesday, July 20, 2010

Daily buy signal

The signal changed today from strongly downtrending to uptrending, without a CIT warning. Not surprising, given that we had a key reversal day on the daily charts. The next upleg has begun....


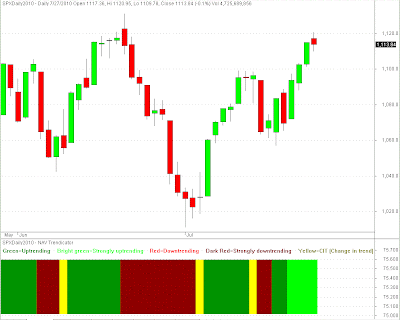
NAV trendicator


Here's a visual look at my system. My system uses no cycles, e-wave, astro, magic numbers, support, resistanace, Fibonacci or for that matter even interanls (breadth, vol, high/lows), Put/Call, VIX, fundamentals, news, earnings, bull market, bear market, cyclical/secular trends et al. It is based on purely price action, price trending rules and price based momentum. Price trending rules and momentum rules are used to charaterize the trend into different phases as

1) Trending
2) Strongly trending (power phase - no countertrend trading should done in this phase)
3) Downtrending
4) Strongly downtrending (power phase - no countertrend trading should be done in this
phase)
5) Potential CIT (Change in trend) => At this point, trend traders should take profits or tighten their stops and swing traders start probing positions against the trend.


Last but not least, this is not a curve fitted system (which are dime a dozen in this industry), with optimized parameters to make the past look good. The system only attempts to characterize the trend and not optimize the buy/sell points. No it won't pick the exact bottom and top tick, if that's your obsession. You would miss one or two candles at the top/bottom. The system also does not have a vision for the future . Consequently, it does not attempt to guess the amplitude of the move or the duration of the move.

Monday, July 05, 2010

Taking a break.

I will be a taking a break from blogging for a while. Good luck trading !

Monday, June 21, 2010

IT and ST thoughts


We are in a ST rally in a IT downtrend. The IT trend turned down after we broke the Feb 2010 weekly pivot at 1044 on 5/25/10. The action is reverse of what happened when we broke the 943 pivot in June 09. Once a weekly pivot is broken, the market cannot repair itself in days and rally to new highs. When the weekly pivots were intact, there were bold statements calling for the TOP of the bull market on the message boards. Now that the weekly pivot is gone, there are bold statements about possible new highs on SPX in the coming weeks. Broken trends don't turn on a dime. If it did, there would be no trend traders around. I hear comparisons of this decline to that of July 07 decline and subsequent rally to another high in Oct 07. Well, the July 07 decline did not break the prior weekly pivot at 1363. So the weekly uptrend was intact then. What we have now is a broken weekly trend which needs to be fixed.


I see two ways this can be done:

1) Complex bottom on the NYSE MCO.

or

2) We establish a weekly pivot in the SPX 1130-1150 area, go down and make new lows and then rally back up and break that pivot.

Until one of these happens, all ST rallies are bound to fail and the IT downtrend will continue. We are in the sweet spot of SPX 1130-1150 where this rally could fail. Currently the ST is on a buy, but keep an eye for a rally failure from this area.

Sunday, June 06, 2010

Complex bottoming action required

Needless to sat that the buy signal from 1085 failed on friday and we are back to sell mode. The NYSE breadth MCO will have to put in a complex bottom, with positive divergence with price, before we see any sustained IT rallies. Until then, all these ST buy signals will produce minor pops and fail. Will update if anything of significance happens.

Wednesday, June 02, 2010

Hourly buy signal - June 2, 2010

For the first time, since this decline started in April, SPX has generated a Short term buy signal on my system. The short term buy got triggered at SPX 1085 today. Technical objective for this buy is about SPX 1140. Will reassess the technical picture if and when we get there.

Thursday, May 06, 2010

Reading the price

Last week i posted that we are in a sell the rallies mode and the status quo remains. However, i personally have not sold any rallies so far, given the way the decline started - with a huge gap-down and no decent rallies to position short.

Although the exchange has busted all the trades below a certain treshold, what remains on the chart is a big wide range bar (100 points wide) on the daily charts. We should continue to see many inside bars within this wide bar range, for the next few days or perhaps weeks. The resolution out of this wide range bar will determine the price direction and targets for weeks to come. If we get a daily close above 1167, then we have seen a bottom today and we should head up to SPX 1270. If we get a daily close below 1065, then SPX 950 becomes the downside target. It is very easy to say the trend is down here, as easy as it was to say the trend is up, just 3 days back. The reality is we are in a highly unstable trading zone. I guess it will be lot's of fun as we whip around in this 1065-1167 area the next few days, before the market makes up it's mind. Trade safe !

Wednesday, April 28, 2010

Sell the rallies mode

Lots of yo-yo action in the last two weeks. With the break of the 1190 pivot, we are back to sell the rallies mode on the hourly charts. So far there is no evidence of any bottom to go long. If there's any, i will update here.

Wednesday, April 21, 2010

Preliminary sell again

I had said i would update if there's any change in the trend resumption scenario. As i said in my last post, we resumed the trend upwards, but today we had a momentum failure near the highs. Momentum failure in itself is not a sell signal. It can just cause a high level consolidation before the move up. But when some key EMAs crossover along with momentum sell, it suggests that the correction can be something more than just high level consolidation.

For instance, today we not only had a momentum failure but the 3/13 ema pair on 30-min crossed over as well. That suggested that the downmove was going to be something more than just a high level consolidation. Even that EMA crossover is not an indicator of trend change until we make lower lows on the price. So if one is shorting against the trend, as i said in one of my posts 2 days back, either the DTL or the pivot has to be honored. In this case the pivot is at 1211 and any move above that is a signal to reverse long. If one is a miser on the stops, they could even get out on DTL break on a closing basis or a 3/13 crossover back above. I use pivots to reverse my position though. At the close the 3/13 was in a backkiss configuration on the 30-min charts. Now the big money folks can easily perform a crossover with a gap-up. But will they ?

Bottomline, aggresive traders can go short with the above mentioned precautions, using the preliminary sell. Others can close longs and stay in cash until SPX 1211 is recaptured.

Monday, April 19, 2010

Correction over ?

Odds are about 70% that the correction is over and a slingshot recovery is in progress. One of the cardinal sins of countertrend trading is remaining short when a downtrend line is broken. Yes sometimes, false trendline breaks happen. Those happen once in 3-4 months. If you are betting on such outcome, it's your money We made a divergent bottom on the hourly and broke the DTL. That should be sufficient indication to hop on the long side in a bull trend. Too many are expecting SPX 1225. So odds are we will overshoot it this time. If anything changes in the trend resumption scenario, i will update here.

Sunday, April 18, 2010

The trend is still up....

But the warning shots have been fired. This is the 4th VST sell signal fired by my system since the Feb 2010 bottom. This selloff has been the largest fastest decline since the Feb bottom, which means it is likely that this is more than a one day wonder. If the market were to maintain the current trend structure, then it has to perform a slingshot recovery to the uspide. If it's a slingshot recovery, we should see big volume coming at the open with green candles. Barring that, the slower moving averages on the hourly charts will start curling over, leading to a more deeper selloff. If the volume is anemic on any bounce from here, i will start scaling into shorts between the SPX 1195-1205 area. A move above 1214 is required to invlaidate the sell setup.

Wednesday, April 14, 2010

IT and VST sell signals

The IT run which begun in Feb has produced three VST sell signals on my system. The first sell produced a max profit of 20 points from the sell trigger point. The second sell was good for 8 points and the third sell was even worse. Well, it only goes to reinforce the lows odds nature of countertrend trading.

Low volatility gives a false security of limited upside risk and hence draws the short sellers. And then divergences are too juicy for the countertrend cowboys to ignore. It's not a crime to short an uptrend, provide one follows some simple trend rules.

1) Don't short a divergence unless, it's accompanied by a trendline break or a pivot break.

2) Don't short a momentum crossover like MACD or Stoch, unless accompanied by a trendline break or pivot break.

3) To take it one step further, don't short any kind of sell signal, unless accompanied by price confirmation in the form of a trendline break or pivot break for the given timeframe traded.

4) Even, if the above rules are followed, strong trends can create pseudo trendline/pivot breaks and reverse. So after shorting, draw a downtrendline and get the hell out of your shorts, if the down trendline is broken, and reverse long.

5) Trendline and pivot breaks should be on candle closing basis, to avoid false breaks.

These are simple TA rules that everyone knows, but ignored, carried away with esoteric TA or personal ego. Then they foolishly state that divergences do not work or Oscillators do not work or TA does not work.

As i posted on March 26, a break of SPX 1181 put us back on a buy signal. The IT picture is not showing the necessary loss of momentum to call any sort of top here. But then the market always looks strong at tops. It's this contradiction that "market does not show any signs of top" and "market rarely shows any weakness right at the top" makes it a futile endeavour to pick tops. When a top of any significance occurs, it will be written in BOLD letters. Yes, you may miss the top 1%and the GURU title, by not picking the top. I will update here, when i see either signs or confirmation of an IT top. Until then, enjoy the trend...
Thursday, March 25, 2010

SPX sell again ! - 3/26/2010

SPX flipped back to a sell at the close today. This whipsaw between sell-buy-sell typically occurs at key reversal areas. That leads me to beleive that this sell signal will run deeper than most think. My strategy here would be to start scaling into shorts from this level and add on any bounces, with a stop at SPX 1181. A move above 1181 will put us back on a buy signal.

Tuesday, March 23, 2010

SPX - March 24, 2010

SPX taking out 1170 invalidated the sell signal and puts us back in a buy mode again. This is probably one of the crummiest sell signal in terms of number of points gained, in the recent months. The sell signal was triggerred at 1161 and the best price the signal could attain was 1152.89, which is about 8 points. Typically these hourly signals generate anywhere between 15-50 points. Again just to be clear, i am not talking about the potential trading profits of this signal, but the maximum points acheived by the signal from the point where it was triggered. In fact, this would have been a losing trade, had one played it for a swing trade. The shallow correction that the signal produced says a lot about the strength of the market, from a pure price perspective. So we are back in buy-the-dips mode, until the next hourly sell gets triggered, which i will post here.

$WTIC (OIL) remains on a daily sell signal.

Monday, March 22, 2010

SPX enters a ST sell

Sorry, i was busy with some business matters and could not update the blog for nearly a month. Finally i have some time on my hands and will actively start updating my blog. I will continue to post the hourly buy/sell signals on SPX and Daily buy/sell signals (instead of weekly) on Gold/OIL/Dollar etc. Sorry, the weekly stuff takes too long to generate signals and is not working out for me.


The last time SPX generated a buy signal was at 1056, which i posted here on the blog on Feb 12. On Friday my system generated a hourly sell on SPX at 1161, which i posted on TT at

http://www.traders-talk.com/mb2/index.php?showtopic=117286

Stop for the SPX sell is 1170.


Along with SPX, $WTIC (OIL) also entered a sell at friday close, at 80.97. Stop 83.36


I will try to post updates on signals at the EOD each day, if there's any change to the signal.

Sunday, February 21, 2010

Weekly signals - 1/19/2010

Weekly trends

OIL (neutral)
Buy 12/24/2009 USO 38.20 stop 35.22 - Stopped out.


Dollar Index (neutral)
Sell 1/15/2010 USD 77.36 stop 78.78 - Stopped out.

Gold (Buy) - Gold issued a buy signal this week.
Buy 1/19/2010 GLD 109.47 stop 102.28
Buy 1/8/2010 GLD 111.37 stop 105.30 - Stopped out

Bonds (buy)
10 year yields on a buy signal since 11/30

Disclaimer: All signals are experimental and for entertainment purposes only.

SPX - Remains on a buy signal

Sunday, February 14, 2010

Weekly signals - 2/12/2010

Weekly trends

My system remains neutral on all the assets. Stay tuned for a fresh signals next week.

OIL (neutral)
Buy 12/24/2009 USO 38.20 stop 35.22 - Stopped out.


Dollar Index (neutral)
Sell 1/15/2010 USD 77.36 stop 78.78 - Stopped out.

Gold (neutral)
Buy 1/8/2010 GLD 111.37 stop 105.30 - Stopped out

Bonds (buy)
10 year yields on a buy signal since 11/30
It's now in a retracement in an uptrend

Disclaimer: All signals are experimental and for entertainment purposes only.


SPX

SPX issued a buy signal this week, with SPX 1056 as the key pivot. Above 1056, the market will remain in a bullish configuration. A break below 1056 will reverse the bias to bearish. Whether this is a countertrend rally or the beginning of a new upleg is unclear at this point. No projections for the rally yet. Enjoy it while it lasts...

Sunday, February 07, 2010

Weekly Signals - 2/5/2009

Weekly trends

With that surge in dollar, all of those assets inversely correlated with dollar got stopped out. OIL was the last one to get stopped out this week. My system remains neutral on all these assets until the next buy signal gets generated (or a continuation sell as the case maybe).

OIL
Buy 12/24/2009 USO 38.20 stop 35.22 - Stopped out.


Dollar Index
Sell 1/15/2010 USD 77.36 stop 78.78 - Stopped out.

Gold
Buy 1/8/2010 GLD 111.37 stop 105.30 - Stopped out

Bonds
10 year yields on a buy signal since 11/30
It's now in a retracement in an uptrend

Disclaimer: All signals are experimental and for entertainment purposes only.


SPX

SPX remains in an intermediate term sell. Given the speed at which it came close to the SPX 1030 pivot, there are two possibilities for this 9 month cycle bottom due in March. Either we are going substantially lower than SPX 1030 or we are going to see some volatile bottoming action beween the SPX 1030 - 1105 area over the next 3 weeks. I guess it all depends on how the debt situation in the third world countries of Europe pans out. Trade the volatility until a bottom is carved out. Good luck !

Sunday, January 31, 2010

9 month cycle thoughts

On Dec 23 i wrote,

Projection


The current e-wave structure displays a potential triple zig-zag, with two upside targets - SPX 1168 (c=a) and SPX 1215(c=1.618*a). The crest of this last 20-week cycle (of the current 9 month cycle) is due end of January 2010, which is where i expect this market to complete it's e-wave formation. After that, it gets bearish as we plunge into the 9 month cycle bottom sometime in mid-March 2010.


Well, we undershot the time target by a week and price target by about 18 points. As i posted here, break of SPX 1131 pivot was the get-out-of-longs signal. The next 9 month bottom is due mid-March. There should be cyclical pressure until that general timeframe. Of course we will zig-zag up and down into that March bottom. Currently i don't have a technical projection. We need a countertrend bounce after which targets can be arrived at. But an educated guess would be the key weekly pivot at SPX 1030.

The entire web is now buzz with the "End of bear market rally" theme. If the next 9 month cycle low comes above the July 2009 lows, which will maintain the bullish cyclical structure, then another high in the SPX is almost certain. It's too early to have an opinion on that. Will update it when the appropriate time comes.

Good luck !

Friday, January 29, 2010

Weekly signals - Jan 29, 2009

Weekly trends

OIL
Buy 12/24/2009
USO 38.20 stop 35.22

Pullback in a weekly uptrend. Buy signal remains on a slippery slope.


Dollar Index
Sell 1/15/2010 USD 77.36 stop 78.78 - Stopped out.

My system is neutral on dollar right now. It remains on a A-B-C countertrend rally with an uncompleted wave C.

Gold
Buy 1/8/2010 GLD 111.37 stop 105.30 - Stopped out

Bonds
10 year yields on a buy signal since 11/30
It's now in a retracement in an uptrend

Disclaimer: All signals are experimental and for entertainment purposes only.

SPX


SPX violated the dubai panic lows of SPX 1083 which i mentioned last week, now putting it in a intermediate term sell. The next logical test would be the support at the weekly pivot of SPX 1030.

SPX is now in a weekly buy, daily sell and hourly sell. The key bull-bear pivot is now SPX 1100.22. All bounces below SPX 1100.22 should be used to sell short. The selloff will likely end in a selling climax in the coming week.

Good Luck !

Sunday, January 24, 2010

Weekly trends - 1/22/2009

Weekly trends

OIL
Buy 12/24/2009
USO 38.20 stop 35.22

Pullback in a weekly uptrend. But, remains on a buy signal.


Dollar Index
Sell 1/15/2010 USD 77.36 stop 78.78 - Stopped out.

The sell signal on Dollar got violated this week by a break above 78.77. I still beleive this week's dollar surge was a wave c of an a-b-c correction, rather than a beginning of a major leg higher. My system is neutral on dollar right now.

Gold
Buy 1/8/2010
GLD 111.37 stop 105.30

No change from last week. But the buy signal is on a very slippery slope right now.

Bonds
10 year yields on a buy signal since 11/30
It's now in a retracement in an uptrend

Disclaimer: All signals are experimental and for entertainment purposes only.

SPX

The dollar surge last week unleashed some violence in many markets. SPX failed to acheive the measured move objective at SPX 1165. 1150 was all she wrote. Violation of SPX 1131 pivot was a close-all-longs signal. Since the SPX has broken the 1131 pivot, the selloff has been very steep without generating any continuation sell or even counter-trend buy signals on the hourly charts. The Key 20-week low pivot at 1085 held this week. If it holds and we generate a buy signal next week, then the ST selloff is over. If SPX 1085 cracks for any reason even by a tick, then the selloff will morph into an intermediate sell, with the next support coming at the weekly pivot at SPX 1030. The coming week should provide more clues....

Friday, January 15, 2010

Weekly trends - 1/15/2010

Weekly trends

OIL
Buy 12/24/2009
USO 38.20 stop 35.22

Last week i said that OIL hitting the weekly bollinger band is usually a place where ST traders typically take profits. But the profit taking was stronger than what i expected. It's now in a retracement in an uptrend, but on a weekly buy nevertheless.

Dollar Index
Sell 1/15/2010
USD 77.36 stop 78.78

Dollar index issued a sell signal this week.

Gold
Buy 1/8/2010
GLD 111.37 stop 105.30

No change from last week.

Bonds
10 year yields on a buy signal since 11/30
It's now in a retracement in an uptrend

Disclaimer: All signals are experimental and for entertainment purposes only.


SPX remains in a weekly and daily uptrend. The selloff after Intel earnings has put pressure on the hourly uptrend, but remains on a buy nevertheless. The SPX 1131 pivot continues to hold any selloffs. If the hourly flips into a sell, i will update here next week.

Friday, January 08, 2010

Weekly signals - Jan 8, 2009

OIL
Buy 12/24/2009
Long USO 38.20 stop 35.22

Oil remains on a buy signal. USO hit it's weekly BB bands which is usually a good spot to take profits. If this market is in a trending mode, we should see the bollinger bands flare up next week.

Dollar
Countertrend buy

Dollar marginally missed a sell signal this week. It remains on a countertrend buy.

Gold
Buy 1/8/2010
GLD 111.37 stop 105.30

Last week, i was looking for a buy on gold and we got a confirmation this week.


Bonds
10 year yields on a buy signal since 11/30
No change from last week

Disclaimer: All signals are experimental and for entertainment purposes only.

SPX remains in a daily and weekly uptrend. We are heading towards the SPX 1165 target with ever decreasing volatiltity. Before excpecting any meaningful correction, we should see the volatility pick-up. Until then all short attempts will be futile. No need to overanalyze here.

Friday, January 01, 2010

Weekly signals - Dec 31, 2009

OIL
Buy 12/24/2009
Long USO 38.20 stop 35.22
No change from last week

Dollar
Countertrend buy
No change from last week. Looking for a sell signal this week

Gold
Countertrend sell
No change from last week. Looking for a buy signal this week

Bonds
10 year yields on a buy signal since 11/30
No change from last week

Disclaimer: All signals are experimental and for entertainment purposes only.


One of the readers question was whether the entry is based on week ending price or opening price next week. For intermediate term positions, it's irrelavent, unless the next week opening happens to be a massive gap-up. But then, many a time, it also gaps-down offering better entry price. I tracks these signals based on end of week closing price basis. To be fair, i will try to post these signals 15 minutes before the closing, end of week, if time permits and does not interfere with my trading activity.

These weekly signals will not be published for the SPX, as the stock market is an entirely different beast, which i will continue to anlalyze seperately. There is no change in SPX outlook. We remain in a daily uptrend from the Dubai lows, pullbacks on hourly charts aside.