Monday, May 15, 2006

Running correction


Here's my e-wave count. Below 1280, this count is wrong and is bearish intermediate term. Otherwise, we should start a 2 months+ relentless advance in the SPX. I will be going out on a vacation for the next 2 weeks and this will be my last post until i come back.

Good trading all !

Thursday, May 11, 2006

Perspective is everthing !


This is as trendless a market i have traded in years. Here's the reason. The market is forming a running triangle, confusing the heck out of everyone. Every daily buy signal lasts two days. Every daily sell signal lasts for two days. But that's the function of the market pattern we are in. I will perhaps have my buy signal fail here, very likely. (a break of 1295.56 swing low will cause my buy signal to fail). This will be the second consecutive signal failure this year after 8 consecutive signal successes.

Perspective is everthing. There's already crash talk on the message boards after a day of decline. Just take a loook at the above chart and see if it's bullish or bearish. By no known measures of trend and momentum analysis can the above market structure be construed as bearish. The market entered the zone of vulnerability only twice over the last year, both happened in the fall of 05, which i have circled in green. Look how the EMA ribbons curled over and crossed the blue line. That's the point of maximum concern for longs. That's the zone where mini-crashes can happen. I have checked back in the history for the last 100 years and no crash/mini-crash has come out of the blue before those darn ribbons curled and crossed over. And of course there are certain momentum signatures before those mini-crashes happen.

If my e-wave count is right we should see a bounce tommorow followed by a failure and retest of the SPX 1290-1296 region and a sharp rally following that. The Nasdaq MCO is forming a positively diverging bottom w.r.t price as long as the April lows on the MCO hold. The NYSE cumulative A/D is still in a bullish configuration. What would turn me bearish here ? - A break of SPX 1280, which would turn the intermediate term down. So until proven otherwise, i am looking for a buying opportunity again.

Monday, May 08, 2006

SPX buy signal at Friday's close

On May 4, i wrote

The NYSE MCO has moved above the zero line. Now if we see a good breadth thrust day, that would create a zero-line rejection on the summation index and would be a good intermediate term buy signal.


That's precisely what happened. We got a good breadth thrust day on friday. The summation index had a zeroline rejection. I think the indecision of the markets is behind us and i would consider this as an intermediate term buy signal.

Thursday, May 04, 2006

Don't fight if the market turns up here

VST, my view has not changed that we get a move here to about SPX 1290. But the resilence of this market has been frustrating to short or hold any shorts here. Here's some comparison between 2003 and 2006 purely from momentum and internals perspective. Will history repeat itself ? Time will tell....


The fractal we are witnessing from Oct 05 is an exact mimic of the A-B-C Fractal that we witnessed from March 03 - Jan 04. July 03 thru Oct 03, we were in this running triangle and then broke out of it and melted-up.

We see the same running trianlge here from Feb 06, which is about to finish and switch into a terminal move. My custom Full Stochastic has the exact same signature, flatlining about the 80 line and turning up. Remember overbought weekly indicators turn down. They rarely don't. On those rare instances when they don't turn down and instead turn up, price goes parabolic. That's what we are seeing on the Full Stoch.The CCI has the exact similar signature prior to the beginning of the running triangle and then showing hesitation (i.e chopping around the 100 line) before the big move. Price action then was around the 8 EMA, which is the case now. Similarities are just uncanny.

Sentiment-wise, there was this tremendous disbeleif then, like we have today. Folks were expecting a 9-month cycle bottom then. Now the talk is all centered around the 20-week bottom. Every messageboard i visit, i see this talk about the 20-week cycle bottom. Then in 2003, the internals bottomed during the 9 month cycle bottom while the price made a higher bottom. We are seeing the same again. The summation index is making it's trip to the zero line, i.e the internals are bottoming while the price keeps moving higher.

The NYSE MCO has moved above the zero line. Now if we see a good breadth thrust day, that would create a zero-line rejection on the summation index and would be a good intermediate term buy signal. For now, waiting and watching for the resolution...

Tuesday, May 02, 2006

Get ready for a fast move down !

My expectation over the last few days has been for a move up to SPX 1320 cash and then a move to 1290. The reason i expect 1320-23 is because that's where the weekly resistance bands passes. Generally markets love to kiss those bands before they make a big move. Given all the hesitation and the overlapping action over the last few days, my best guess is that the uncertainity will resolve down towards the 1290 area. The NYSE summation index would also have completed a trip to the zero line by then.

Markets can always throw a curve ball. If for any reason we get a daily close above SPX 1320 then this scenario is wrong and i will have to turn neutral and reasses the situation. Will the market hit the 1320 resistance band ?. I am not completely certain. There's always a possibility of a failure below that level. This is one heck of a nervous market, until the Fed meeting is done with. Bottomline, any sell on 30-min tommorow will get me aggresively short.

Sunday, April 30, 2006

Not ready to break out yet

My best take on the market at this moment is that the overall structure remains constructive for a bullish case. But the ingredients from a momentum perspective and from the internals configuration doesn't allow for a breakout just yet !. In the VST (over the next couple of days) we could see NQ test the 1740 area and the SPX cash test the 1320 area followed by a failure. The failure should retest the SPX 1290 area which is now a solid support.

My expectation is largely based on the momentum and EMA configuration that i am seeing on the SPX daily charts. From the internals perspective, the markets have been rallying in the face of the NYSE summation index drifting lower. This means the money is leaving the markets without causing much price damage, which is not necessarily bearish relative to the overall strength of the weekly cumulative A/D line itself. LOL, i was right about the summation index making a trip to the zero line. I thought that would have been accompanied with severe price damage. Boy, was i wrong ! This market seems stronger than i thought. Now once the zero line trip is complete, by which time we should see a minor price damaage, which i mentioned earlier i.e a trip to 1290 on the SPX.

Now the million dollar question in my opinion begins after that ? Will the summation index turn up from the zero line ? If it does, imagine what would happen to the sideline money, the bears etc ? I think that would create some serious upside pressure. I guess it's not clear at this point whether we cross thru the zero line or have a rejection at the zero line. So it's putting the cart in front of the horse. We will deal with it when we get there.

For now, my expectation is a a VST move higher to about SPX cash 1320 and a failure, a retest of 1290 and then.....

Thursday, April 27, 2006

Crummy market !

I think this market has been as crummy as i have seen in a while with no conviction to move either way.

Anyway with all the excitement that we saw today, my system never went to a buy. NDX remains on a daily sell. SPX which has been relatively stronger than NDX, which was close to making new highs coudn't generate a buy signal. Worse among the lot, DOW made new highs today and still remains on a daily momentum sell (I think this is as crazy as it gets). NQ might double top around 1752 area. But that's about it for that sucker. I don't think NDX will make new swing highs in this swing. Call me a skeptic. The odds favour some downside fireworks starting anytime here. The bottom pickers got their azz saved today - thanks to Fed obesssed programs !. All the technicals i watch, says down. If the markets trumps all those technicals, i won't fight it, but won't be obsessed with it either.

Monday, April 24, 2006

SPX sell signal at close today

As you might recall, i posted this a couple of days back.

Now if the DOW starts correcting here, it would push the SPX CCI below 100 and NDX will seem like a rejection from the 100 line. So the implication is that some sort of a short term correction will begin soon. If this scenario were to transpire, it won't be a plain garden variety ST correction. The reason being the daily MACD is already hovering near zero and if we were to get a continuation sell on the MACD, the MACD would dip below the zero line. Selloffs when the MACD is below the zero line are generally brutal.


The post market action seems to confirm my above anaysis.

My system issued a daily sell signal on SPX at close today. I am expecting a sharp selloff over the next few days. The NYSE MCO had a zero line reject today. This market has been pushing against internal divergences. The sentiment seems to be one of "Divergences don't matter anymore". I think the market is about to give a surprise to the bulls here.

Just one look at this tells all

http://stockcharts.com/gallery/?$NYAD

Good trading to all !

Thursday, April 20, 2006

Why i am not too excited about the upside here ?

Some simple intermarket analysis. Daily CCI(14) on DOW is around 199, SPX is 129 and NDX is around 90.

DOW is already at extremes which implies some sort of correction to kick in on the DOW. Now if the NDX and SPX starts moving higher along with the DOW, DOW CCI would reach very extreme territory and will end up as a blowoff move. Not very exciting if one is positioning for a swing move on the long side, cuz the reversals from the blowoffs could be swift. Look at what happened to GOLD and SILVER today !

Now if the DOW starts correcting here, it would push the SPX CCI below 100 and NDX will seem like a rejection from the 100 line. So the implication is that some sort of a short term correction will begin soon. If this scenario were to transpire, it won't be a plain garden variety ST correction. The reason being the daily MACD is already hovering near zero and if we were to get a continuation sell on the MACD, the MACD would dip below the zero line. Selloffs when the MACD is below the zero line are generally brutal.

So my strategy at this point would be to daytrade the hourly until either one of the scenario transpires and then take a swing short position once my system issues a sell.

Wednesday, April 19, 2006

Commodity complex on fire !


The entire commodity complex and the 10-year yields are on fire. If one thinks that the Fed is done, as portrayed by the media, i think they must be smoking something really heavanly. I think a 50bp hike in May is now becoming more of a reality, if this commodity meltup is to be contained. Now if the stock market were to discount that hike before that actaully happens, then we should see a serious drop in the markets before the Fed meeting. At least, that's the conceptual framework from which i am operating. Now whether that drop comes from higher levels or right from here is not clear at this point. The daily momentum indicators are still on a momentum buy. I am still waiting for a sell signal from my system. Until i get that signal, i will avoid swing trading and continue to trade the hourly charts in both directions. In the VST though, i expect a gap-down tommorow morning and a swift selloff. And then the OPEX circus should continue for the next 2 days. Overall i am bearish now and i expect the NYSE summation index to make a trip to the zero line or undershoot it, while the NYSE MCO puts in a divergent bottom, before any meaningful rally resumes.

Tuesday, April 18, 2006

Extreme to Extreme to Extreme...

This market is simply not playable from a swing trading perspective. The only way to play this market is either daytrade of if one is swing trading, blindly pick the extremes with the hope of getting it right. If one waits for a technical confirmation of any sort, then the move is over by then. To illustrate a case in point, the momentum flipped to a sell on 4/11 and that was the day the daily CCI(20) hit -255. Do you go short then ? I think one would have been obliterated if they played leverage and went went short on that day. That's one of the reasons i turned neutral on that day. Every momentum buy on my indicators is not a buy signal or every momentum sell is not a sell signal on my system. I have rules to determine what is a valid buy/sell signal.

As i said on April 11 on this blog
In any case, this is the land of quick or dead. Long and shorts are equally dangerous. With this kind of CCI configuration, we could easily see a 20 point short squeeze or a 30-40 drop kind of moves in a day.

While in hindsight, it always looks easy and one could say, "i could have gone long yesterday with tight stops and caught this move". The cycle folks have been expecting this 5 week bottom since the last week. So one could have gone long a few times in the last week and got stopped out multiple time, unless one does not use stops. Two of my indicators flipped to long today, while one more indicator did not. In other words, i still don't have a buy signal despite the obsence move today. By the time i get confirmation, this move could be over.

The daily CCI has moved from +226 (Extreme) on 3/16 to -255 (Super Extreme) on 4/11 on now is gunning for another extreme, perhaps. If this market corrects back and puts in a constructive bottom, that would be the time to go long for a swing trading long. On the other hand if we blowoff here and put another CCI extreme, that would be a constructive top to go short from. Right now we are technically still in the land of "Quick or dead". So my system remains neutral with no signal at this point as we are stuck in this zone of high risk.

The reason for the market rally as the media potrayed was the FED minutes which hinted at the rate hike campaign nearing an end. That's pure garbage. The economy is operating at full capacity at full employment levels and the liquidty is still sloshing around the globe at unprecedented levels. When the FED met the last time GOLD was not at 620 nor was silver or copper or OIL, which are all at crazy heights. The commodity markets are just going nuts. The situation has clearly changed, dramatically so from the last Fed meeting. So to assign any value to the last FED meeting minutes is meaningless. The FED rate hike campaign has been eerily simlar to 1999-2000. After a series of 25 bp hikes from 1999 to March 2000 Fed meeting, we got that 50 basis points hike in May 2000. My feeling is history is about to repeat itself and we could see a 50 basis points in the May 2006 Fed meeting, which i think now becomes necessary, if the Fed were to contain the commodity markets melt-up here. Time will tell.

So will i lie by the poolside and sip Pina Coladas while i don't have a signal ? Heck no. I will continue to daytrade this market in the directional of the hourly trend. When my system issues the next buy or sell signal, i will post on this blog.

Tuesday, April 11, 2006

Zone of high volatility

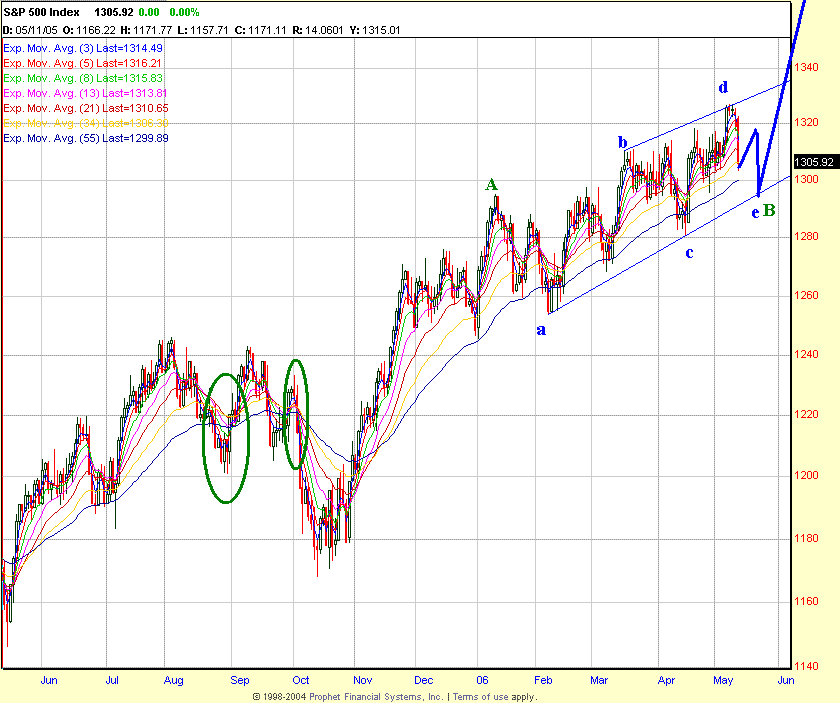
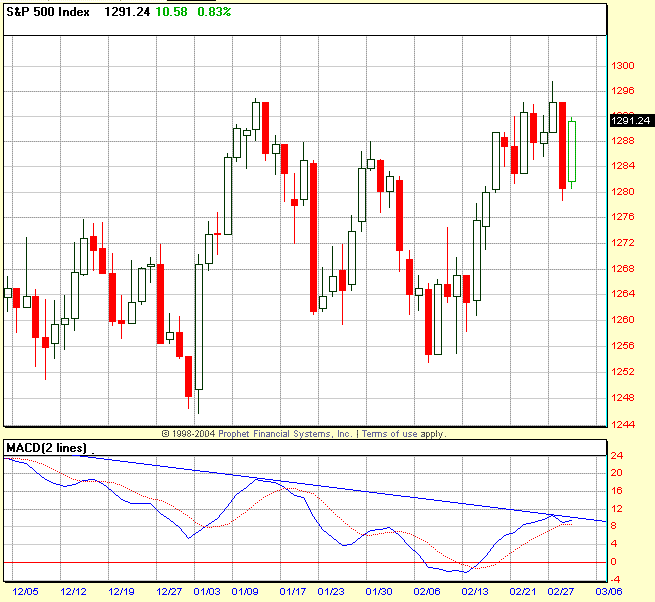
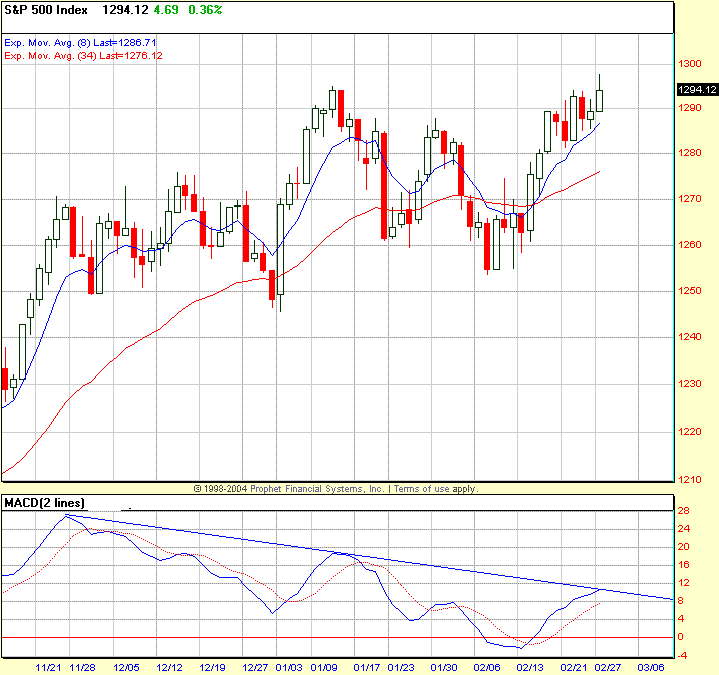
As i posted in the morning, after taking out the 1291.84 swing low, my signal from 3/29 ended in a failure, after seven consecutive good signals this year. A buy signal failure does not automatically generate a sell signal, as i have rules as to what constitute a buy/sell signal. So i turn neutral at this point.

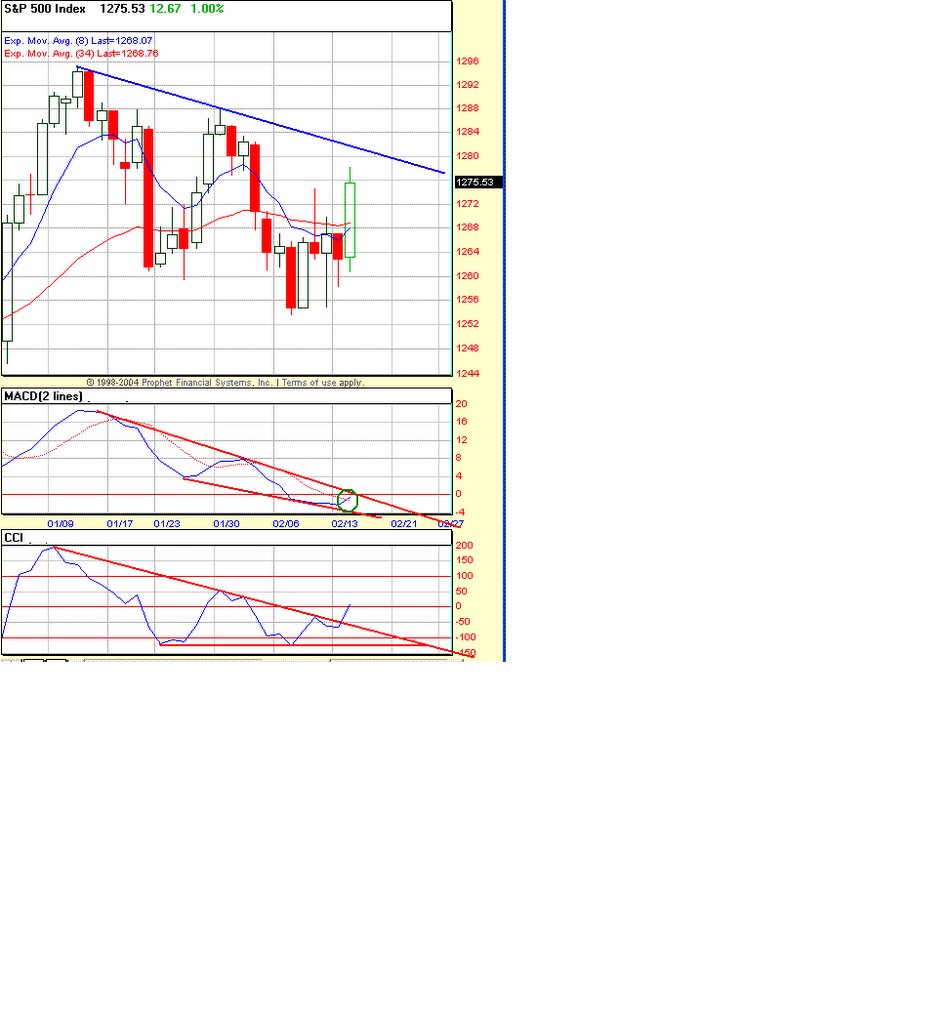
The rules from my system aside, the market is now in a zone of Meltup or Crashes. Here's what's fascinating technically at this juncture. The daily CCI(20) went below -250 at the close on SPX. Here are those rare instances in the last 10 years when the CCI went below -250 and when a ST bottom occured.

3/31/97 - Bottom came 3 days later
10/27/97 - Bottom came one day later
8/28/98 - Bottom came 2 days later
5/25/99 - Bottom came 2 days later
4/14/2000 - Bottomed on the same day
10/11/2000 - Bottom came a day later
3/11/2004 - Bottom came 3 days later
4/15/2005 - Bottom came 3 days later

In all of the above instances a ST bottom occured within 1-3 days of CCI closing below -250. In some cases it was a "V" bottom and in some cases the bottoms were retested after a few days of bounce. There's nothing magical as to why this happens every time. If one understands how the CCI is constructed, it's one of the most sensitive momentum indicator out there, as long as it remains between -100 and +100. Once we go above/below +/- 100, the sensitivity drops rapidly. That is a large price movement is required to produce even a small delta on the CCI. Below -250 it becomes almost impossible to push this indicator down anymore. If we were to move from -250 to -300 tommorow, it would require a huge price drop to the tune of 40-50 points on SPX. In other words a mini-crash would be required. And guess what would happen if a mini-crash were to occur, price would snap back like a streched rubber band, cuz it's uncharted territory below -300. So any mini-crash here, if it were to happen, will be all retraced within a matter of hours. Look at April 2000 to get an idea as to what i am talking about or the 1997 mini-crash. If a mega crash like 1987 were to happen, that's a different story. Saying CCI went below -300 and we had a crash in 1987 is totally meaningless without relating to the trend configuration at that given juncture. During 1987, the 8 EMA had crossed below the 34 EMA. The 55 EMA was already sloping down, not to mention the internals then. Today we have a totally different internal configuration and trend configuration. The 8 EMA is still above the 34 EMA. The 55 EMA is still sloping up. The EMA ribbons i am watching are still pointed up to flat. They need to start curling down before we can even start talking about a mini-crash.

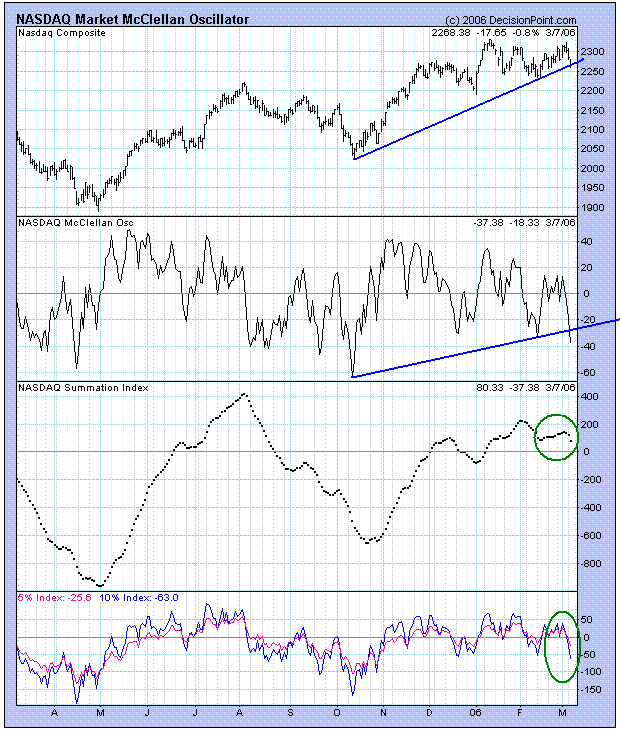
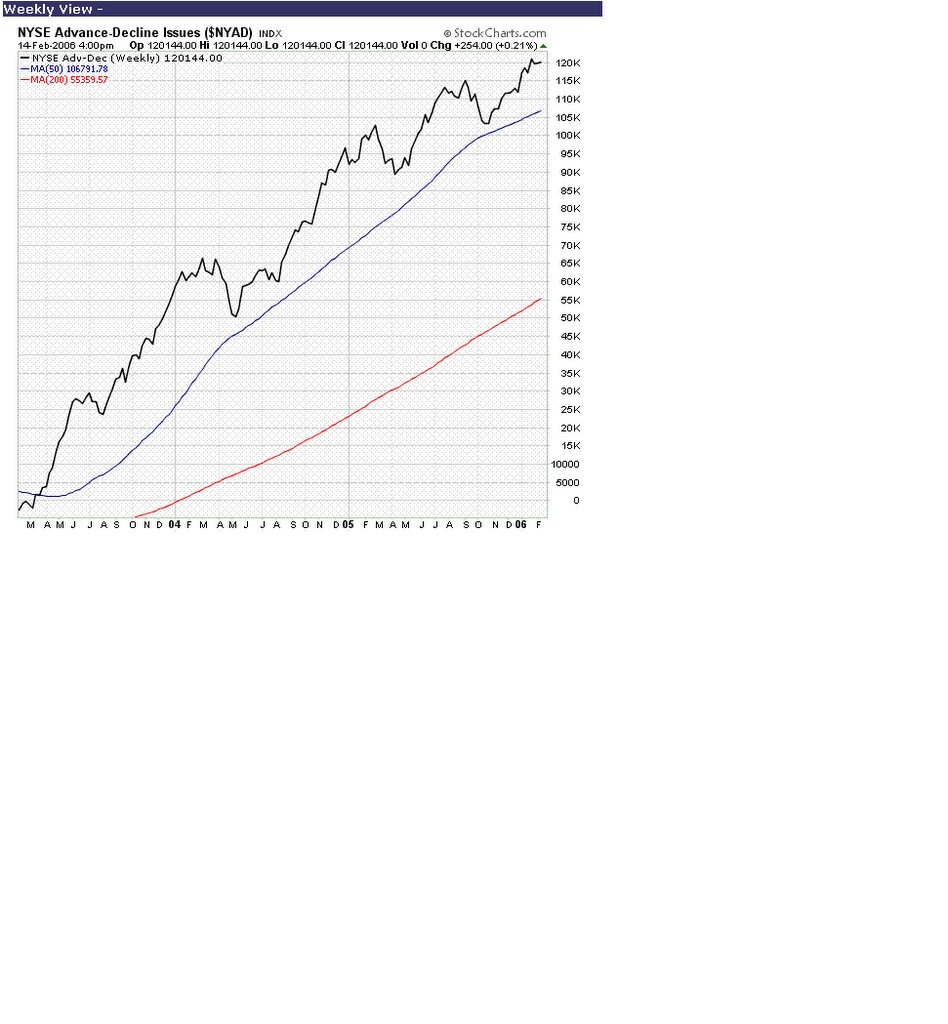
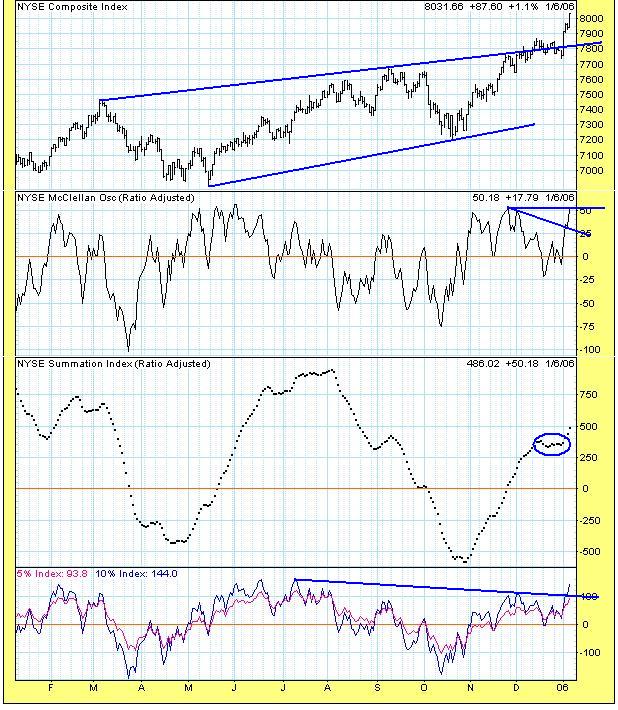
There were a few developments today, as far as the internals are concerened, which begs attention. The NYSE MCO took out the March bottom. The 5% and 10% components of the MCO moved belwo the zero line. The NYSE cumulative A/D line went below the 39 EMA. These are negative developments and in the past have led to intermediate term declines. So what this tells me is even if we rally here, a retest will required before a constructive IT bottom falls in place. On other hand if decline sharply without a bounce, then a "V" shape bottoms becomes a high probability event, based on the CCI configuration. In any case, this is the land of quick or dead. Long and shorts are equally dangerous. With this kind of CCI configuration, we could easily see a 20 point short squeeze or a 30-40 drop kind of moves in a day. It's going to be very volatile the next few days as the bottom gets put in place. Think Oct 05 bottom. It's the territory of daytraders the next few days. If we move up tommorow, i will look for a secondary sell signal. If we move down, i will be looking for a buy signal. For now, i am neutral and will daytrade the heck out this market, the next few days. So i patiently wait for the next signal at this point. Until then, good trading...

Buy signal from 3/29 fails

SPX buy signal from my system, from 3/29, ended in a failure today, after taking out the 1291.84 (swing low of March 28). This is the first failure out of 8 signals this year. It was very unusual that i had a string of 7 good signals in a row. So it was about time to get a failure, i guess. It's too risky to short here or go long. So i will turn neutral. The next signal could be either a continuation sell or a buy. So we wait....

Sunday, April 09, 2006

Spooked by the 10-year yields

My system remains on a daily and weekly buy signal. We went close to a weekly and daily combo sell signal on Friday, but escaped by a hair's breadth. I think we should bottom early Monday and take off to the upside again to complete this intermediate rally. Based on the current configuration, i am expecting an intermediate term top to form in about 2 weeks


What's spooking the market right now is the 10-year yieds challenging the 25 year old declining tops line. If the 10-year yields break out of the channel shown in the chart, then the technical implication is that a long term trend change has occured in the long end of the curve. Now that does not mean the yields will melt up in the next few months or we will bust thru the channel immediately. Such multi-year resistances are generally not taken out in the first attempt. So we may have to challenge this resitance a few times, before we break out. The bond market vigilantes, if they still exist (LOL) have finally awakened from their deep slumber, it seems.

The global liquidity glut has reached insane proportions. My guess is the Fed would increase the rate by 50 basis points in May, just like they did in May 2000 (when they increased from 6 to 6.5). It could be deja vu all over again. Again that's just my guess, which i beleive will be necessary, if they were to avoid a bond market and dollar carnage here. I think the stocks will continue it's sideways to upward bias until this ocean of liquidty is worked off, which will take a while IMO. As long as Gold keeps rallying, the liquidity spigot is alive and well. I think the first shots of waning liquidity will be fired in the emerging markets, the junk bonds and then the Gold markets. It's only then the stock will start a major long term correction. Until then i think we continue with this frustrating sideways to upward grind......

Tuesday, April 04, 2006

Mired in a trading range

Nothing much to add. We have been mindlessly zig-zagging in this trading range for the last couple of weeks. To me it appears like a high level consolidation before the breakout, which are supported by the internals.

NYSE cumulative A/D line - new highs (both daily and weekly)
Nasdaq cumulative A/D line - new highs on daily
High TRIN, High P/C at or near market highs

There was a small change on the Nasdaq MCO today. So expect some big volatility in this index over the next couple of days.

Thursday, March 30, 2006

Buy/Sell signals from my system this year on SPX

I have had eight buy/sell signals from my system this year, which i have been posting on this blog. These buy/sell signals are generated at the end of the trading day. So far no failures. Failure happens if the price takes out the prior swing low on the daily charts after the signal is generated. So far among all the signals generated this year, in none of the instances has the price taken out even the prior day's low, after the momentum buy/sell was generated. This year has been atypical in that too many signals have been generated, given the narrow range we have been bouncing around in.

The following are signals this year and the maximum points that each signal would have potentially generated, which is shown in the parenthesis. Note that the maximum points does not necessarily mean that a trade would have made that many points. The number points a trade would have made is entirely dependent on the trade management, such as how many times one enters and exits within the context of a signal, how one trails the stops etc. So the number points made can be either less or more than the maximum potentail shown below, based on how one manages his/her trade.

Jan 13 - Sell ( 28 points )
Jan 26 - Buy ( 14 points )
Feb 2 - Sell ( 17 points )
Feb 14 - Buy ( 22 points )
March 2 - Sell ( 21 points )
March 14 - Buy ( 13 points )
March 22 - Sell ( 13 points )
March 29 - Buy (In progress...)

Avg 18 points per signal

Wednesday, March 29, 2006

SPX buy signal at close - Terminal move ?


My system went to a buy signal at close today, having been short since 3/21/06. I will keep the comments short today. A picture is worth thousand words. After a long time a clear e-wave count seems to be emerging. SPX appears to be forming an ending diagonal here.

Tuesday, March 28, 2006

Will the support hold ?

On March 21 i wrote,

The price trend as evidenced by EMAs is still up without a question. But the momentum went to a sell today. When this happens we typically go down and test the rising EMAs. Remember we had gotten far above the rising EMAs. So some correction was required to bring the prices back to mother earth. I think the brutal selloff we saw on SPX was a wave A selloff. We should see another wave B up and another wave C down to about 1290-1295 region before the uptrend resumes.

Today the wave C tested the 1290 dynamic support. Little did i know last week that it would take so long to test this region. My system remains on a daily sell signal from March 21. My guess is we will get a momentum thrust tommorow, which should issue a buy signal on the daily. I bought some April ES calls around 1301 in anticipation of that. I don't like front running my signals, but sometimes when the risk/reward is too good, i take it.

The larger question for tommorow is, will the SPX 1290 support hold ?

Wednesday, March 22, 2006

Tommorow - Beware of the tactical play

Assuming that we did a wave A yesteday and today's rally was a wave B, then the most obvious way this decline should start is that wave B will either top below yesterday's high or double top at yesterday's high and then do a wave C selloff. What concerns me here is everyone is aware of that pattern and this is what the technical traders are expecting.

What would fool everyone is a tactical play here. There are two ways to do that...

1) Expanded Flat - Wave B will make new highs and then a violent wave C down which will bottom below wave A.

2) Running correction or a irregular flat - Wave B will continue this choppy advance way higher than most shorts would want to be comfortable with and then a wave C decline down which will bottom above today's low.

Both these scenarios can confuse the heck out of everyone. If we make new recovery highs tommorow, then i will start looking to go long on any decline, instead of looking for shorts anymore.

Tuesday, March 21, 2006

SPX momentum sell signal at close


As i noted yesterday the bollinger band squeeze resolved to the upside. Late day we had a nasty selloff. The small change on Nasdaq MCO for 3 consecutive days was warning about some nasty volatility to come. We saw that today. Well that 1315.93 resistance (2001 May highs) proved to be formidable. It's not typical to clear such a multi year resistance on the first attempt. All beared up ? Don't...

NDX is in a daily sell for a long time and it has totally different configuration and is more vulnerable to a downside surprise. Nasdaq summation index is also ready to curl below zero, which won't be a pretty thing if it does.

Let's focus on the SPX. SPX is in a solid uptrend so far, but with that nasty close today, my system generated a momentum sell at the close. The price trend as evidenced by EMAs is still up without a question. But the momentum went to a sell today. When this happens we typically go down and test the rising EMAs. Remember we had gotten far above the rising EMAs. So some correction was required to bring the prices back to mother earth. I think the brutal selloff we saw on SPX was a wave A selloff. We should see another wave B up and another wave C down to about 1290-1295 region before the uptrend resumes. We have had a nice 5 wave impuse from 3/8/06, which would qualify as a wave 1. So my best guess at this point is we are in a wave 2 correction, which should end at the 50% retrace of the impulse, which is around 1290. After that i expect a strong persistent wave 3 advance, which should purge all the remaining bears. This scenario could change if we get a daily close below 1290. For now this remains my preferred count.

Another techincal matter of interest is that the daily CCI on the SPX went above 220 during this runup. Market does not do certain things without intentions. In the past on those rare occasions when the daily CCI had gone above 220, it had resulted in major trending phases. I don't have time to post those charts. But take a look at 1997-2000 when at least 4 or 5 times the CCI went above 220 and checkout what happened after that. It could be an eye opener.

The sentiment picture is very interesting. I have never seen so many bears at the top. With so many rydexers shorting the indices from their retirement accounts, it's hard to conceive a major bull market top happening here. There's simply no acceptance of the rally. Everyone is either obsessed or worried about a 4-year top here. Whether we made a 4 year top or not is totally immaterial from a trading perspective, unless you are advisor trying to make a name for yourself or keep your subscription base sufficiently excited. I am sure a host of advisory services today will be screaming 4-year cycle top from their rooftops !

None of the daily signals i have got this year on SPX have failed so far. I have a sneaking feeling that this sell signal could end up in a whipsaw.

Bottomline , the next couple of days or as long as this sell signal is alive, i will be looking to short the indices on a intraday basis. I am not comforatble taking a swing short position at this stage at all.

Monday, March 20, 2006

Bollinger bands are getting squeezed

The SPX daily remains on a buy signal.

On the SPX hourly the bollinger bands are squeezed tight. Today appeared like a high level consolidation on the hourly charts. The hourly oscillators are oversold with little damage to price. So my guess is this consolidation will resolve to the upside tommorow.

Nasdaq has had 3 consecutive small change days on the MCO. This means a big price move is coming in the Nasdaq in the next day or two. The price move tends to be large when we have such huge indecision on the MCO (in this particular case for 3 days). Caution is the keyword here.

Friday, March 17, 2006

Significant developments


SPX daily, remains on a buy signal from March 14. Technically we are at a very exciting juncture.

For the first time, we had a weekly close above the ascending wedge, since it begun in 2004. Ascending wedge is a technically bearish pattern. But on those rare occasions when we manage to break above the wedge, it becomes an extremely bullish pattern. It's a very significant development. Breaking out of the wedge is called a throwover, if it reverses quickly back into the wedge. So any failure here could be nasty. We need sustain above the upper trendline of the wedge to maintain a bullish posture going forward here.


On the otherhand, all the internals are pointing to a healthy breakout here. Nasdaq and Semis have been the laggards, which is keeping a lot of folks from not participating or not beleiving in this rally. The NYSE daily and the weekly cumulative A/D lines are blasting higher and are making new highs. The NYSE MCO has taken out the Feb highs. The MCSUMS on both the NYSE and Nasdaq have turned up. NYSE cumulative TICK and cumulative New highs- New lows are all making new highs. The OBV on SPX is at new highs. No diveregences anywhere, as far as the NYSE group of stocks are concerned. On the other hand, the Nasdaq internals, such as the weekly cumulative A/D line looks downright horrible, which is what is keeping the folks bearish. Every internal measure i am seeing on the NYSE are looking healthy at this juncture, which makes me beleive that this could be the real Mccoy !, after a year long trading range.


Here's another chart to put things in perspective. After breaking out above the 2002 highs in late 2004, we have been in a trading range for the most part of 2005. Now we are about 8 points away from taking out the May 2001 highs at 1315.93. If 1315.93 gets cleared and holds next week, things could get very hot on the upside. Then SPX 1388 would become the next technical expectation. It's not typical of the markets to clear such major resistances on the first attempt. So i would expect some backing and filling around these levels before we clear that resistance. Notice, the monthly CCI has broken out of the long trading range we have been in since the beginning of 2005. So we do have the momentum thrust to breakout into a large impusive move here.

Any daily close below 1295 would bring the breakout into question big time !

Tuesday, March 14, 2006

SPX buy signal at the close


The dreaded V bottom bagged the bears today.

My system issued a momentum buy signal on SPX at the close today, having being short since 3/2/06.


I mentioned a couple of days back about the Technical vs the Tactical trading. On March 10 i wrote,

On the other hand DOW issued a daily buy signal today, suggesting a "V" bottom might be in place. I don't trust the DOW and NDX daily signals for i think SPX is the proxy for the U.S markets. SPX and NDX remains on a solid sell. Remember this market is all about tactical trading. My above mentioned technical scenario may or may not work, as the whole world knows how to pick a divergent bottom, creating efficient markets, if such a scenario were to pan out. So from a tactical trading perspective, we are at the right juncture to mount an assault on the bears. There are tons of bears out there with huge stops above the SPX 1300 level. And SPX is just 15 points shy of the 1300 level. So if we were to rally and take out the 1300 level, there should some massive short covering. Also NDX is perched just below the declining tops line from 3/3/06. If we were to gap up above that trendline on Monday, a lot of trapped NDX bears could get scorched badly.


The technical expectation of a "W" bottom apparently did not occur. The tactical trading dominated once again and the dreaded "V" bottom is in place now. Look at how nicely the CCI put in a V bottom. Bottomline, i will be looking for longs going forward.

Monday, March 13, 2006

No change

SPX and NDX remains on a sell signal. DOW remains on a buy signal. There's a good chance that DOW could make new recovery highs. Will be looking for shorts tommorow..

Friday, March 10, 2006

Be careful out there...

I coudn't post yesterday as i had problems accessing the blog.

However, i posted this at www.traders-talk.com forum yesterday

http://www.traders-talk.com/mb2/index.php?showtopic=49601

Based on channelling, SPX cash 1286-88 seems like a strong magnet right now. Even time wise, the correction is not complete. My guess is either we go up straight and test that area today noon or decline in a wave B and do the wave C up tommorow to satisfy the time requirement.

Now the first part worked out fine. My opinion has not changed even given the ugly close today. I think we rally in a wave C to 1286-88 area tommorow and then continue with the downtrend.


This forecast worked in a picture perfect way. I went long at ES 1283 and got out around the 1294 level. I was looking to go short in a big way around the ES 1296 level. But as we rallied to the 1295 area on ES, the hourly oscillators were barely overbought, which suggested more upside. More importantly DOW gave a daily buy signal at that point, while the SPX and NDX daily remained on a daily sell. Something was clearly wrong and i didn't go short. Then we had a scary decline and an equally sharp rally thereafter.

Strictly from a technical perspective, if we were to put in a solid intermediate bottom, we need to decline here to retest the 3/08/06 lows, which would create a nice divergent bottom. From all the technical evidence i have at this point, the bottom is not in. I think the internals have put in a bottom as of yesterday. The strong breadth we had today can be treated as accumulation and a snapback action towards the zero line. So we still need to see the price bottom, which always follows the internal bottom. Going by this strict intrepretation of the current scenario, we should see a scary decline next week to test the price lows of 3/8. That would create a nice "W" bottom both on the price momentum and the MCOs, which would give a solid fondation for further rally.

On the other hand DOW issued a daily buy signal today, suggesting a "V" bottom might be in place. I don't trust the DOW and NDX daily signals for i think SPX is the proxy for the U.S markets. SPX and NDX remains on a solid sell. Remember this market is all about tactical trading. My above mentioned technical scenario may or may not work, as the whole world knows how to pick a divergent bottom, creating efficient markets, if such a scenario were to pan out. So from a tactical trading perspective, we are at the right juncture to mount an assault on the bears. There are tons of bears out there with huge stops above the SPX 1300 level. And SPX is just 15 points shy of the 1300 level. So if we were to rally and take out the 1300 level, there should some massive short covering. Also NDX is perched just below the declining tops line from 3/3/06. If we were to gap up above that trendline on Monday, a lot of trapped NDX bears could get scorched badly.


So technically speaking no price bottom yet, but from a tactical viewpoint, we might have seen it. Bottomline i will still look for shorts on SPX next week, but will change my opinion in a heart beat, if the price action proves me wrong and i get a daily buy on SPX.

Be nimble ! Have a good weekend...

Wednesday, March 08, 2006

Run for roses or Run for exits

Let's throw the emotions(one day rally), fundamentals (BOJ decision) and funnymentals (Wierd Wollie Whatever..) aside.

Let's look at basic TA. As i mentioned yesterday, the hourly Full Stoch was putting in a complex bottom, which suggested a sharp rally for a day or two. So today's action did not surprise me. The daily momentum is still on a solid sell. CCI(14) on the daily SPX went to -190. When the daily CCI reaches this low levels, it's hard for market to rally without putting in a divergent bottom. CCI(20) failed to turn up even with today's rally and is forming a shelf from which it can fall off rapidly. CCI(20) also has more room to run on the downside. The only way the market can rally in these kind techincal scenario is a straight run without pause which can create a V shaped bottom. Typically when a V shaped bottom happens, the rally out of the bottom tends to be very sharp and we see a 2%+ day. Had we got a 2% rally today and the CCI(14) had hooked above 100 and the CCI(20) had hooked above 0, that would have been a good indication that a reverse divergent setup was confirmed and a V shaped bottom is behind us. But today's action had none of those characteristics.

What is in the bulls favor though is a series of High TRIN days and High P/C ratio days. When the market is trending up and a couple of high TRIN days occur, it could be a sign of a ST bottom. When the market is already in a downtrending mode and we see the high TRIN days, it generally is a precursor to a capitulatory kind of selloff, which has not happened yet.

My own take is we run for the exits before we start the run for the roses. Will look for shorts tommorow, if we don't see a strong run up in the morning.

Tuesday, March 07, 2006

NYSE UGLY, NASDAQ BUTT UGLY

My system remains on a daily and hourly sell signal, since 3/2/05. The SPX hourly put in a complex bottom on the Full Stochastics today, which suggests that some kind of snapback rally should be expected here to releive the oversold condition. But as far as the daily goes, there's nothing to suggest that a bottom is in. The first dynamic support on the SPX cash at 1271 held today. If 1271 gets taken out over the next couple of days, the next support would be around SPX 1255.

The NYSE and the Nasdaq A/D stunk today !

The NYSE MCO took out the Feb 06 lows, while price broke the tredline from Oct 05. The 10% component of the NYSE MCO went decisively below the zero line, while the 5% is close to doing it.

The Nasdaq broke it's trendline from Oct 05 lows. The Nasdaq MCO also plunged below the Feb 06 lows. Both the 5% and 10% components of the MCOs on Nasdaq are now decisively below the zero line. The weekly cumulative A/D line on the Nasdaq looks ugly, to put it mildly. So Nasdaq is the index, which is more vulnerable to a severe price decline here.

Bottomline, i will be shorting every bounce going forward.


------

Thursday, March 02, 2006

Sell signal on SPX

My system issued a sell signal on the daily (both SPX and DOW) at the close, after being long since 2/14/06. Any new recovery highs on SPX will invalidate the sell signal. Will start looking for shorts tommorow.

Wednesday, March 01, 2006

Don't short a high TRIN day !

When the market is already downtrending and the TRIN goes high, it's indicative of a washout or climactic kind of downmove to come. When the market is at the highs or making new highs and we get a high TRIN day, it's indicative of VST panic, typically induced by fundamental events and a buying opportunity for those believe in the trend. Yesterday we had a NYSE TRIN of 2.2, barely a day after making new recovery highs. That's a tough market to short in my opinion.

Like a broken record i have been saying over the past week that the market is an yellow zone, where it's vulnerable to bear attacks and that's precisely what happened yesterday - GOOG news induced panic selling. The NYSE MCO dipped below zero which caused some excitement among the bears. As i have been saying, as long as the MCO 5% and 10% components are comfortably above the zero line, a temporary dip by the MCO below the zero line is a non-event. It appears that the weak hands have been flushed now and the market appears to move higher.


One of my trusted indicators (MACD), which i have been discussing over the last week for a potential triple divergence sell, curled down yesterday, but did not generate a crossover. Today it appears we had a backkiss on this indicator. So if the market consolidates over the next day or two and blasts higher, the MACD will blast thru the declining tops line on the MACD, in which case look out above.

My system remains on a buy signal since 2/14/06. The hourly which had turned down yesterday, has turned back up today. Bottomline, i will continue to buy the dips on the hourly charts, until the daily turns down.

Tuesday, February 28, 2006

Close but no cigar

My system is on a hourly sell, but the daily remains on a buy signal. It went close to a sell, but did not generate one. As i posted yesterday, we still remain in a "Yellow Zone", Where the daily trend and momentum is neutral at this point. It could tip either way. To keep it simple, if the hourly turns up, i would start looking for long trades again. If the daily turns down, i will join the bears. If today's support fails on the SPX, the next dynamic support on the SPX daily comes around the 1270-1272 area.

The MACD chart i posted yesterday has curled down, but yet to give a crossover. Crossover or Kissback ? - I guess, we'll know tommorow.

Monday, February 27, 2006

Still in the Yellow zone


My system remains on a daily and hourly buy signal. However, my indicators continue to remain in the "Caution zone". My MACD is still in a zone where it could curl under and give a triple divergence sell or break thru the overhead resistance and trigger a massive short covering. Until more clues surface, the trend is up, and i will continue to trade the long side.

Thursday, February 23, 2006

Yellow Flag


The lack of follow thru today, has put the SPX in a vulnerable position. We could push towards another marginal high, before the correction sets in, although not gauranteed. SPX 1286 is the ket pivot now. If 1286 gets taken out, it would start turning the hourly trend down and 1282 will be the next support. If we break below 1281, it would almost gaurantee a larger degree correction and push the daily trend back down again. From a momentum perspective, that would also generate a triple divergence sell signal on my MACD, which could be nasty.

Bottomline, the hourly and daily trend are still up, but vulnerable to a bear raid. Unless we see a strong upside day tommorow, the odds that a correction will set in here, is very high.

Wednesday, February 22, 2006

Again the buy signal from 2/14/06 remains in full force. There's a lot of disbeleif in the rally, while the price continues to march higher. The hourly, daily, weekly are all on buy. NDX was the laggard, which sprung to life today. A lot of shorting and disbeleif in the rally is focussed on the expected 4-year cycle bottom this fall. Instead of playing what is offered today, many traders are focussing on what could happen 6 months from now.

A lot of advisors were convinced that the 4-year cycle top was in. Today the SPX was half a point shy of making new recovery highs. The bearish sentiment backdrop suggests that the rally has much higher to go. Bottom line, the daily is on a buy and i will continue to buy the dips.

Just a general comment on the liquidity situation. Look at the POMOs (Permanent Open Market Operations). That's permanent money coming into the system and keeps rotating thru the system, with the multiplier effect, magnifies the money supply. I can't emphasize the importance of it. I thought Jan was a blockbuster POMO month, but Feb is not way behind. The same excess liquidity can also be seen very clearly on the NYSE cumulative weekly A/D line, as far as the flows into the stock market are concerned.


Thursday, February 16, 2006

Acceleration time !

Since my buy signal 2 days back, the market has rallied nicely. The daily CCI on the SPX moved above the 100 line today. This is where the rubber meets the road. This is where the price acceleration takes place. But then, this is also the place where the price failures happen. Since my system (or any other system for that matter) is built on the premise of beleiving the signals and not on anticipating the signal failures, i would give the benefit of doubt to price acceleration here, with stops just under today's lows at 1280.

There seems to be no dearth of liquidity in the marketplace. Both the daily and weekly cumulative A/D line on NYSE are at new highs today. It's just a matter of time the price will !

http://stockcharts.com/gallery/?$NYAD

Tuesday, February 14, 2006

SPX buy signal on daily


As i noted on 2/10/06, all my indicators were compressed in a wedge. Today the CCI broke out of that compression. My MACD indicator had a crossover. My system gave a buy signal at the close on the SPX daily charts. Note that my system is based on the indicators i have shown in the above charts and some more. But the buy/sell signals are based on objective intrepretations of the indicators, which are strictly rule based without any of my subjectivity coming into picture.
Momentum is always a leading indicator, which breaks out before the price. The price is yet to take out the declining tops line, which would add confidence to the signal. Bottomline, my daily is on a buy as of today's close after being on sell since 2/2/06, which means i will start buying pullbacks instead of shorting strength.


Meanwhile, the NYSE weekly A/D line continues to remain in a very constructive mode. Hard to get bearish, from a intermediate term perspective, against such strong inflows of liquidity into the marketplace .

Friday, February 10, 2006

Wedging in - But no turn yet !


My system remains on a daily sell both on a trend and momentum basis. Based on the chart above, the market appears to be trapped in a descending wedge formation (both the price and momentum oscillators). The momentum oscillators have expended a lot of energy, but barely any price damage has been done. This is typical momentum signature of a market's move when it reaches exhaustion. Bearish e-wavers could call this as a series of 1s and 2s ie market coiling up, before the big 3rd of 3rd move comes. It cannot be ruled out though. If that's the case, we should see a big price move and the momentum oscillators should pierce thru the lower trendlines of their respective wedges. Looking at the internal structure of these waves, they are all 2-legged moves. So i woudn't bet on the series of 1s and 2s thesis here. I would rather bet on the descending wedge thesis.

On the otherhand, if we get a up move on Monday and the Price/Mom oscillators close above the upper trendline of the wedge, a powerful upmove should ensue.

In situations like this, the benefit of doubt should be given to the trend which is down currently, until it changes, and be nimble when it changes. My guess is we do some backing and filling here, test the lower trendline of the wedge and then break out of the wedge to the upside.

Bottomline, no turn yet ! - Still on a sell....

Tuesday, February 07, 2006

Still on a sell

Nothing much to add here other than the sell signal from 2/2/06 holds. The next dynamic support on the SPX cash comes around 1244 on the daily charts. Once the 1244 support is tested, i will start looking for a buy signal at that point. So far there's no bottoming action to speak of. So let's give the benefit of doubt to the downtrend.

As a side note, there's too much dumb money shorting this market. Advisors are very bearish. There's too much talk about the expected 4-year cycle bottom this fall. All this means the 4-year cycle bottom this year will be a muted affair in my opinion, not the mega decline many are expecting.

Thursday, February 02, 2006

SPX Sell signal at close


My system generated a sell signal on SPX at close. Look how the ribbons curled back down below. The CCI briefly went above zero flirted there for a couple of days and now it's back below zero again. My MACD indicator also had a crossdown. All point to a retest failure and what i call as a secondary sell signal. Classic whipsaw action. Reminds me of 10/04/05.

Nasdaq and NYSE MCOs turned back down below zero again, pointing the respective summation indices down. What a difference a day makes ! Yesterday it seemed like a hourly breakout on the DOW, which turned out to be a big fakeout.


Let me make it clear. My job is not to predict the future or provide target projections. It's to identify the trend reversal points and align with it. My system has done a darn good job in identifying the reversals. Here's the daily buy/sell signals for 2006:

1/13/06 - Sell
1/26/06 - Buy
2/2/06 - Sell

Can we get a whipsaw again ? Sure we can. It's not my job to predict the signals from my system. I don't anticipate my signals nor do i double guess it, when i get one. I have paid dearly when i have done that in the past. Right now we have a sell and let's go with the flow, until it reverses.

Wednesday, February 01, 2006

Reverse head & shoulder breakout on the hourly


The daily on the SPX and DOW remains on a buy. We have an interesting pattern in the DOW. Seems like we are breaking out of a reverse Head & Shoulders patters, which means there's another 150-200 points on the upside left before any serious correction kicks in. Above is the hourly chart of the YM (Dow E-mini), which shows the breakout.

Sunday, January 29, 2006

Banging into resistance - Critical Juncture


On 1/26/05, my system generated a buy signal. Yesterday's follow through strengthens the signal. now we are at a critical juncture as far as momentum is concerned. In the above chart, notice the CCI is trying to do a crossover and so is my customized version of MACD indicator. If we see a sizeable selloff on Monday, both the indicators can encounter a backkiss, which will generate secondary sell signals. I am not saying that will happen, but something to keep an eye on this Monday. The Daily trend is bullish and i will go with the flow, for now.

Thursday, January 26, 2006

Momentum buy signal at close


My system gave a momentum buy signal on SPX at the close today, on the daily timeframe. When the sell signal was generated on the SPX on 1/13, i had noted that we would go down to test the rising EMAs (34/55). We tested the 55 EMA yesterday and we had a nice green candle today on good volume and breadth.

The last few days of selling was on high TRIN, which means it was a narrow based, high volume selling in few issues (mostly the large caps), while the small caps were displaying high relative strength.

From a e-wave perspective, it appears that we have completed a irregular flat from 12/14/05.

For my buy signal to be valid here, we should hold above today's low of SPX 1264.68. Any daily close below that would put the buy signal in question. Any close below the swing low for SPX at 1259.42, even on a intraday basis, will kick the system back into a secondary sell, in which case things could get nasty on the downside.

Anyways, i have a buy signal and will be looking to buy dips rather than shorting rallies as long as this buy signals holds.

Saturday, January 21, 2006

Just some perspective


Given the good breadth on the NYSE, i had thought yesterday that the divergences between the DOW and SPX would be resolved to the upside. Boy, was i wrong ! We saw a washout kind of move in all the indices. So have we topped ? Has the IT correction begun ?

It's too early to be talking about any sort of trend change here. A week back i said, when we have a momentum sell in the IT uptrend, the price comes back and tests the rising moving averages i.e the 34/55 EMAs. My own expectation from the beginning of this correction was for the price to come back and test the 34 EMA. Yesterday, we saw a failure at the 34 EMA. So the next expectation is the test of 55 EMA around SPX 1258 or we may slighly undershoot it, given the high mometum of the move.

To get a better perspective of what's hapenning i have shown a ribbon chart of Fib EMAs (3,5,8,13,21,34,55). Notice how all the EMAs converge and crossover when a trend change happens (beginning and end of Oct 2005). Currently we are nowhere close to that kind of a move to even start talking about any trend change. Any talk of trend change at this point is just one person's opinion or gut feel. The price action has not yet confirmed a trend change or even close to it. A big red candle does not mean anything other than creating fear and bearishness among the retailers. Also notice how the 55 EMA flattens out as the topping process happens and as the price retests the prior highs. A retest failure and the covergence/crossover of the EMAs would be a bearish sign and a sign of trend change. We are nowhere close to that.


Anyway for the very short term, since the daily momentum continues to be strongly down and the hourly is very oversold, we should see some more downside probing, backing and filling action around the 55 EMA as the bottoming action happens. The next leg up and the strength of the move will tell us if we have indeed topped or if this move down was just another pullback in the uptrend.

Thursday, January 19, 2006

Momentum buy signal on the Daily charts

SPX and NDX gave a momentum buy signal on the daily charts. DOW is still on a momentum sell. Now the question is whether this divergences will resolve to the upside or downside. Based on how strong the RUT and SMH were today and the fact that the Mclellan Oscillators on the NYSE and Nasdaq crossed back above the zero line, odds are that the divergences will be resolved to the upside. We need to see a strong follow thru tommorow to keep the bullish case alive. Otherwise as i noted yesterday, the rising EMAs will start to flatten out, causing a potential trend change.

Wednesday, January 18, 2006

Still on a momentum sell

My system has been on a momentum sell since 1/12 and continues to be in that mode as of today's close. If we close in green tommorow, i will get a momentum buy signal on the daily again. On the other hand, one more down day tommorow will start flattening the rising EMAs and could potentially change the trend. But for now, the daily trend remains up and this is nothing more than a pullback in the uptrend. Since i trade the momentum and not the price trend, until there's a momentum buy, i will continue to play the short side of the market.

Daily - Sell
Hourly - Sell
30-min - Sell
15 min - Buy

Tuesday, January 17, 2006

3 Gap play

As posted on 1/12, if the market closes in red on 1/13, my daily momentum would kick into sell. So as of 1/13 my daily momentum has been on a sell and continues to be in that mode as of today's close. But remember the daily trend is still solidly up. When this happens typically the market comes down and tests the rising EMAs (34 or 55).

Intel report has caused a selloff after hours, which means there will be a gap down on all indices tommorow morning. The troubling part for the shorts at this point is, we have a 3 gap play on YM and ES, i.e three unfilled gaps on 1/12, 1/17 and 1/18 (unless we fill today AH selloff in the overnight session). When there is a third gap down, typically the market goes into a climactic selloff and reverses swiftly. So i am looking for some kind of bullish reversal in tommorow morning's session

Thursday, January 12, 2006

VST decline over ?

The VST 1-2 days scary decline that i posted yesterday is almost done or very close to be over. A reverse divergence setup is close to getting confirmed on the 60-min charts. Will start looking for signs of bottom and the long side tommorow. Today's decline qualifies as a wave C of the running correction.

If tommorow closes in red, the scenario could change completely, which would kick the daily momentum to a sell and a retest of the 1/3/06 lows will be in order. So i will be watching tommorows action closely to get more clues.

Both Euro and YM had great day trading opportunities today, with virtually no exit for shorts

Wednesday, January 11, 2006

Bumping against a Brickwall


There's a cluster of resistances between 1290-1300, which is unlikely to be taken out in the first attempt. So a reaction is very likely here. The markets have been moving up in a corrective advance the last few days. When the market is moving up in a corrective fashion and making new highs, it means that there's so much bullish pressure that the correction is happening to the upside instead of to the downside, which is called a running correction in e-wave terms. The strong breadth behind the move also confirms the running correction thesis. Based on the strong internals behind the advance, this leg-up is likely to continue for weeks instead of days. If SPX 1300 gets taken out, then SPX 1335 will come in a flash.


I am expecting a 1-2 day scary correction here, which will weaken the bulls resolve and bring out some mega bear warnings from the usual suspects. Then a move higher to fade both the weak bulls and aggresive bears. Same Old .. Same Old !

Saturday, January 07, 2006

Why is everyone so beared up ?


We are having breakouts on most indices with solid internals and yet there's so much disbelief. I think this whole disbelief in the rally stems out from the fact that the majority are now looking for the 4-year cycle bottom in 2006, which is a very widely publicized event. The wide acceptance and positioning for this event makes it a slim probability occurence now. Look what happened to the much publicized 80-week cycle bottom that was furiously discussed last week.
Instead of asking why the market is rallying in face of the current fundamentals or why it shoudn't be rallying as theorized by the market letter writers, one has to look at what the internals are suggesting.

Take a look at the above chart of NYSE. Price has clearly broken out of the wedge that so many have been discussing. This whole wedge theory has been clearly invalidated at least on the NYSE. I noted a month back on this blog why the wedge theory is bogus, given the interrelationship between the the different wave components in the wedge, which doesn't confirm to the Ending diagonal requirements.

The 5% and the 10% components of the MCO have already taken out the Nov 2005 highs. The NYSE MCO is close to taking out the Nov 2005 highs. If this happens then the bears looking for an intermediate or a long term top will be dissapointed here. The summation index has formed a ledge and is now moving higher, which is again a very bullish sign. I don't see any reasons to get bearish in the face of such solid internals. In fact such bearishness here can only lead to one heck of a rally. The system is awash with unprecedented liquidity and don't fight it.

The Hourly/Daily/Weekly/Monthly trends are all up. In the VST we are very overextended. So, we may get a small pullback starting Monday, but every pullback is a buying opportunity at this stage until the current technicals/trend change.

Thursday, January 05, 2006

Bearish setup on GOLD

Two charts says it all !


As far as SPX is concerned it's a tough call. One has to play by the ear. It appears like a rectangular consolidation on the hourly charts and ready to breakout. But the hourly is ovebought and some retracement is due, before the next leg up. Also a 80-week cycle low is due around Jan 13.

Wednesday, January 04, 2006

Bear market rally theme continues

Before i left for vacation, i said that there was some more downside work left and it appears that the downside work is over.

The rally theme of the last 3 years continues. Every reaction off of the top is taken as the next mega bear decline signal. The system gets clogged with shorts and the programs kick-in and squeeze the juice out of the bears. It was surprising as to how much bearishness was seen on the message boards over the last couple of weeks for a mere 30 point decline on the SPX. Bears arguments are getting more and more fundamental rather than technical, justifying for a big decline to come. Two arguments at this stage are the expected 4-year cyle bottom in late 2006 or early 2007 and the latest being the Yield curve inversion, a precursor to a recession.

However, the technicals tell a different story. The daily MACD is comfortably above the zero line impyling that the bullish uptrend is still intact for now. We may have seen a zero line reject on the MACD yesterday which means that the next leg up might have begun. It's a tad early to say that, but based on the size of the move and the technicals, i think the odds are that the next leg up is underway.


From a e-wave perspective, i think yesterday we finished the wave B of an expanding triangle and wave C is now underway. Until more confirmation comes, i will have to give some weight to the alternate count as well. My alternate count is that yesterday was a news induced rally (a wave X) with another A-B-C downleg yet to come. If my alternate count is true, we should find support around the SPX 1230 levels. At this stage, i will wait for a retracement and see how it plays out, before commiting to either count.

For now, the hourly trend and momentum is up and will look for day trades in that direction. The hourly is getting overbought here, so some sort of retracement/consolidation of yesterday's move is to be expected here.

Saturday, December 24, 2005

Happy holidays all !

No updates till 1/2/06.

Happy holidays all !

Wednesday, December 21, 2005

Bearish Backkiss on the hourly charts


As i mentioned on Monday, the 120-min on NDX was in a deeply oversold condition and a bounce was overdue. Today we bounced hard but reversed nastily into the close, creating a bearish backkiss on the hourly EMAs and a zero line backkiss on the MACD. This suggests that there's more work to be done on the downside. Today's high should remain intact for the bearish case here. If today's highs are taken out, it would confirm a reverse divergence setup on the daily charts, which would lead to new recovery highs on all the indices. I doubt that's the case given the rally failure today, but it helps to be open minded when it comes to trading.

Overall we remain in a overlapping choppy market. So these days i tend to trade the 15-min and hourly charts to maximize gains. Trading is not really a sophisticated game that requires one to use Fractal geometry, Parabolic curves, Gann angles, Neural networks Fourier analysis, Spiral calendars et al to make money. They all look sexy on the charts, but not add much to the trading bottom line. Throw in a bunch of EMAs to follow the trend and moementum indicators to signal the reversals and you are all set.

Good luck trading and happy holidays.

Monday, December 19, 2005

Hourly sell on all the indices


The hourly went on a sell on all the indices today - DOW, SPX, NDX and RUT on both momentum and trend basis. There were no-brainer setups to go short today, if one followed the 15-min charts. Here we are in a seasonally bullish period and technically awful looking markets.

The e-wave count on NDX got invalidated as soon as we broke below the lower trendline of the triangle. That's why it pays to watch the momentum indicators and not get married to the wavecount. The 120-min on NDX tells the story for today, which is extremely oversold. A -300 reading on the CCI(20) and it has hooked back above it. The Full Stoch is almost oversold.

The daily on the NDX suggests two possibilities, either a slingshot reversal from here or a trip to 1640-1645 where it meets the 60 EMA, just to get everyone beared up and another attempt at nominal highs. If we were to make any nominal new highs on the indices here, the upmove have to be swift i.e a slingshot kind of move. Instead if we churn sideways after the decline, the bear has started....


The daily CCI on the SPX is right near the zero line, where a reversal can start anytime. I am not too beared up on DOW and SPX at this point as far as swing trading is concerned. Both are right at the support zones. If we fail here, then 1240 (SPX) and 10680 (DOW) would be next major support zones.

Saturday, December 17, 2005

NDX - E-wave count


NDX sports a clear e-wave count, following all elliot rules, chanelling and alternation. If the lower trendline of the triangle gets taken out, then this count is wrong.

Friday, December 16, 2005

SPX - Weekly, Daily, Hourly

My anlaysis is based on Trend and Momentum. Best signals come when both are in Sync. Blind trend following is dangerous. Look what happened to Gold last week. The upward trend was intact, but the momentum clearly gave a sell signal. Those who ignored the momentum got clobbered.

There's been a lot of top picking and top calling in the stock market. Let's examine what the markets are saying.

SPX Weekly - Momentum buy, Trend Buy


The weekly picture is very clear. We have a weekly breakout and the market is consolidating above the breakout line. Look at the CCI, which is yet to show divergences with the price. This most likely means the top is at least another 1-2 weeks away. The weekly Full Stoch is also rising and no crossover there.

SPX Daily - Momentum Buy, Trend Buy


The daily trend is up as evidenced by the EMAs and the trendline itself. The daily chart is a bit of concern in the ST term. The price is perched on the trendline, break of which could lead to the retest of recent lows. So far we have had 4 failed breakout attempts. Again we need momentum divergences here, which has not yet been established.


SPX Hourly - Momentum Sell, Trend Buy


Hourly chart is suggesting some sort of expanding formation here. Look at how the CCI is going from extreme to extreme, which is typical of an expanding environment. In a contracting environment, the CCI keeps oscillating around the zero line. Hourly is on a momentum sell, but is still a buy on a trend basis. If we take out the trendline from 12/8, we could see some serious selling, causing the EMAs to slant downwards and create crossovers, issuing a trend sell. Until the Trend and momentum are both on sell, it's a weak sell and one tends to accumulate a lot of false signals in the long term by taking those weak signals.

So for VST, i will go long on Monday, if we get a hourly momentum buy. If the hourly trend turns down, i will go short.

Thursday, December 15, 2005

12/15 - Intraday observation

10:00 AM PST

The intraday pattern on DOW seems eerily similar to 10/3. High at the open and a nasty selloff and a sideways flag. We'll see if we get a big 2:00 PM EST selloff. Intraday pattern looks very similar, but the daily configuration is very different though. Just an observation.

I am looking to go short here, if i get a sell signal on the 30-min.


1:30 PM PST

Except for the initial spike and the thrust down (one buy and another sell program neutralizing each other), nothing else transpired today. I don't expect much to happen tommorow either, being a OPEX day, other than some crazy intra-day spikes. The hourly and daily trend remains intact so far and the bias continues to be to the upside.

Wednesday, December 14, 2005

SPX - Patience bears

The market played almost exactly to my script yesterday. We moved up (did not gap up), came back retested 1276 on ES and shot higher. The daily and the hourly trend continues to be up. So the winning trades will be on the long side, until that trend reverses.

I admit this rally is long in the tooth and can reverse nastily anytime. So swing trading on the longside is a risky proposition. One can make 20 points on SPX and give it all back in a day. Or worse enter at the top and lose big money. Best strategy is to wait for good 15-min or 30-min setups and daytrade the market with tight stops in the direction of the hourly trend. For instance today on YM, at 10920 there was a good 15-min momentum buy setup, the 15-min EMAs were pointed up and it required a 13 point stop. Took it and traded for a 50 point profit (almost 1:4 risk/reward).

There were inter-market divergences today between NDX and SPX/DOW - warning signs that a top is getting close. As for the targets, i still beleive SPX 1285-1290 is in the cards.

I cannot provide the signals from my system for entries and exits, as that would constitute buy/sell advice. But i will try to post the Daily and hourly trend/momentum and trend turns as i get signals from my system. My goal for this blog is to continually remind myself of the underlying trend and at the same time share it with others. Comments are always appreciated and if you have any ideas or analysis you would like to share with me, e-mail me at nav-ta@hotmail.com.

Tuesday, December 13, 2005

SPX - Next leg up underway...

As i said yesterday, it was a tinderbox situation. The powder just had to be lit. When the hourly EMAs are as flat as my abs, the risk/reward becomes even on both the sides. That's why i hate those situations. I would rather take a trade when the EMAs are moving up or down.Having said that, i will be looking for daytrades in the direction of the hourly trend which is up for now, when i get a good setup.

This move looks like a headfake, but that's what the final leg up is supposed to look like. I think the market will rally with poor breadth and volume with the shorts fighting all the way up. I will better be a bit late and let the downtrend establish itself again before jumping on the short side. Me thinks SPX 1285-1290 is in the cards. If the hourly turns down here anytime, i will be quick as lightining to change my bias and join the shorts. Until then, long is my song...

Look at how nicely they created the zero line reversal on the CCI(14).


My preferred scenario for tommorow is probably a gap up and then come down retest the 1274-1275 on ES (1264-1265 on SPX) and then take off to the upside. If SPX 1261 is broken kiss a goodbye to the uptrend.

Monday, December 12, 2005

SPX - Tinderbox situation

Tommorow is the FOMC day again, which means what Greenie says or not says will cause a big move. The Daily and the Hourly continues to be on a sell on the SPX, more so on the DOW. The daily CCI(14) is still hovering below zero, but barely so.

It's a tinderbox situation. The hourly EMAs are flat on the SPX, which means it doesn't take much to create a hourly buy or sell here. Since the daily CCI is barely below zero, it doesn't take much to create a zero line reversal and a daily buy here. So keep your powder dry and follow the big money, after they push the buttons post Fed announcement. I am completely flat here.

Sunday, December 11, 2005

SPX 12/11/05 - Possible bearish diamond formation


As mentioned on Dec 07, we got our gap filled on ES at 1252.50. Now do we race up to new highs from here ? Purely from a e-wave perspective we never got a wave C (clean 5 waves). So the downside appears incomplete at this point.

SPX appears to be squeezed in a possible bearish diamond formation. SPX 1250 is the key now. Is 1250 gets taken out, the next minor support is in the 1241 area and major support around the 1230 area. My expectation is for a test of the key 1230 area, get everyone sufficiently beared up and then take off to the upside for the year-end rally.

From a momentum perspective, the CCI(14) has broken below the zero line. The Full Stoch has rolled over, suggesting there's more work on the downside. But given the size of the decline relative to the thrust out of these oscillators suggests that this is not the beginning of the next major leg down, instead a correction in the uptrend.

For now the daily and the hourly trend are down. Go with it. Shorting the bounces on the intraday charts would be the theme for the next few days, until the hourly turns up.

Wednesday, December 07, 2005

High level consolidation over ?


Based on how the e-wave pattern is emerging, it's looking more like a high level consolidation rather than a topping process here. Here's some interesting Fibo relationships


The first leg wave A on ES (1272.50 - 1250.50) = 22 points.
Irregular Wave B (1250.50 - 1274.50) = 24 points.
Wave C (1274.50 - ??) = 22 points

?? = 1252.50, which would make wave A = wave C

The whole structure here looks more like a irregular flat which should end tommorow at 1252.50, which will also fill the last thursday's gap-up. Then a run to new highs around SPX 1285-90.

If 1250.5 gets taken out, then it could turn out be an expanded flat correction with a target of 1245. If we break below 1242.5 on ES, then something more bearish is in works and we might have seen an important intermediate top.

Anyway bottom piciking is always dangerous. So it's better to wait for a 30-min or a hourly buy signal and get aboard the train. If one were to bottom pick here, the safest instrument would be options and definetly not futures.

SPX - Right on the channel support


As i said yesterday, if ES takes out 1268, then we should make nominal new highs. We did make nominal new highs which ended in a sharp reversal. The inter-market divergences were telling a story for those who wanted to listen. NDX and SPX made nominal new highs while, the DOW coudn't. SPX has still not issued a hourly sell, although it's on a 30-min sell. If 1263 (channel support) gets taken out on the ES, there could be some serious selling. For now 1263 is the key. If it's taken out, my strategy would be to short the bounces.

Tuesday, December 06, 2005

SPX Daily - 12/6/05

The message boards on the web are humming with the talk of DOW 12000, 14000 etc. There's this elusive last leg up left and it's year ending with 5. There are well intentioned advise from bulls, as to why it's not worth being short here even for a very short term trade. This kind of sentiment is what intermediate tops are made of. While a last furious leg of rally cannot be ruled out, we have to work with what the hourly and daily momentum are saying at this point.

The daily is close to a sell, but not confirmed. The hourly was on a sell on all the indices - NDX, DOW and SPX at yesterday's close. With the gap-up work, they have managed to move the SPX hourly to a buy, but the DOW still remains on a sell. Still short from 1267 on the Dec ES. If we take out 1268.25 on the Dec ES, i will stand aside. If we take out 1268.25, then we could see a double top at 1273 or slightly higher highs.

Thursday, December 01, 2005

Kissback of broken trendline or a breakout ?


Yesterday's hourly sell on SPX was good for 13 points, if one covered at yesterday's close. If one held it till today morning's big gap-up, it would have been a breakeven to slighly profitable trade, depending on where one exited. Had they not created that monster gap up, it would have taken quite a while for them to turn the hourly up. The shorts would have sensed the hourlies turning up and start covering thier positions at lower levels, without leaving much fuel for a breakout. On the other hand a huge gap up ensures that the shorts will start covering at higher levels rather than lower levels, causing a breakout.

This is smelling like a false breakout for now. So far the price action has kissed the broken trendline from below. A failure here could mean a retest of yesterday's lows. I would call this another good shorting opportunity with a hard stop around 1273.25. If 1273 is taken out, i would stay away from the short side until another good setup comes up.

Wednesday, November 30, 2005

SPX - Hourly Sell signal today morning


Going forward, i will share the signals from my Momentum/Trend trading system. The signals from my system never comes at the exact tops or bottoms for a simple reason, because tops or bottoms can never be identified in real-time and are known only in hindsight. When a market is at or near the top, for instance, the moving averages are pointed upward and the momentum is up (although the the rate of change of momentum is slowing down i.e a divergence). As long as the momentum breaks and the moving averages turn around, the market is essentially in a uptrend. If someone catches a top, it's just luck. There's a price to be paid for top and bottom picking. Tops and bottoms can be picked with multiple probes with tight stops and stop outs. The multiple stopout losses can add up and at the same time, one would also lose the opportunity of participating in the uptrend. My hourly trading system is designed to give a sell or buy signals about 5-10 points from the top or bottom and the signals could be valid for anywhere between 1-5 days and sometimes even more. I will try to post the chart with buy/sell signals from my system everyday on ES (E-mini S&P 500) and Gold, with stop loss levels. Today morning i got a sell on ES at 1263 and so far remains on a sell. I will not try to preempt my system by attempting to closeout my positions before the signal reverses. If the market makes an extreme move, i may opt to take partial profits. So it's essentially swing trend trading, but exiting and reversing when the trend changes.

Wednesday, November 23, 2005

Why this is not 1998 ?


There's been comparisons of this rally to the 1998 rally. Both the rallies started after scary decline into Oct lows and a strong reversal from there.

Look at the position of the MACD during 1998. Weekly MACD made a new high during April 1998 which clearly suggested that new price highs will come down the line. Once the MACD peaked in Jan 99, we started seeing a series of higher highs in price and lower highs in momentum.The present MACD configuration looks eerily similar to 2000 April rather than 98.

Tuesday, November 22, 2005

SPX daily - 11/23/05 - Breakout or Breakdown imminent


If we break above that hourly channel, that's gonna be a massive breakout. If this is a genuine trending move, this is what we should expect. Typically wave 3 of 3 starts from these kind of setups. The daily CCI is still comfortably high above 100.

On the other hand, if we are in a range bound enviroment, what better chance to short, right at the top of the channel ?I don't know at this point which one's true. So will wait for the market to answer.

Monday, November 21, 2005

Updated E-wave count for SPX


After much analysis, examining the relationships betwen the different waves in the wedge, i have come to the conclusion that what is transpiring here is not a wedge, but a double zig-zag from march 03. Ending diagonals have specific relationship between waves i.e wave C=.618*wave A and wave E = .618 * wave C. Not only do we not see this relationship here in the wedge (which has become a popular count among the e-wavers), but also the current structure from the Oct 05 bottom is looking pretty darn impulsive. Based on this new wave count, there are two potential targets for wave C (1254 and 1308). This wave C should conclude the first leg of the Bull market from the March 03 bottom, leading to a large decline into 2006 and 2007.